







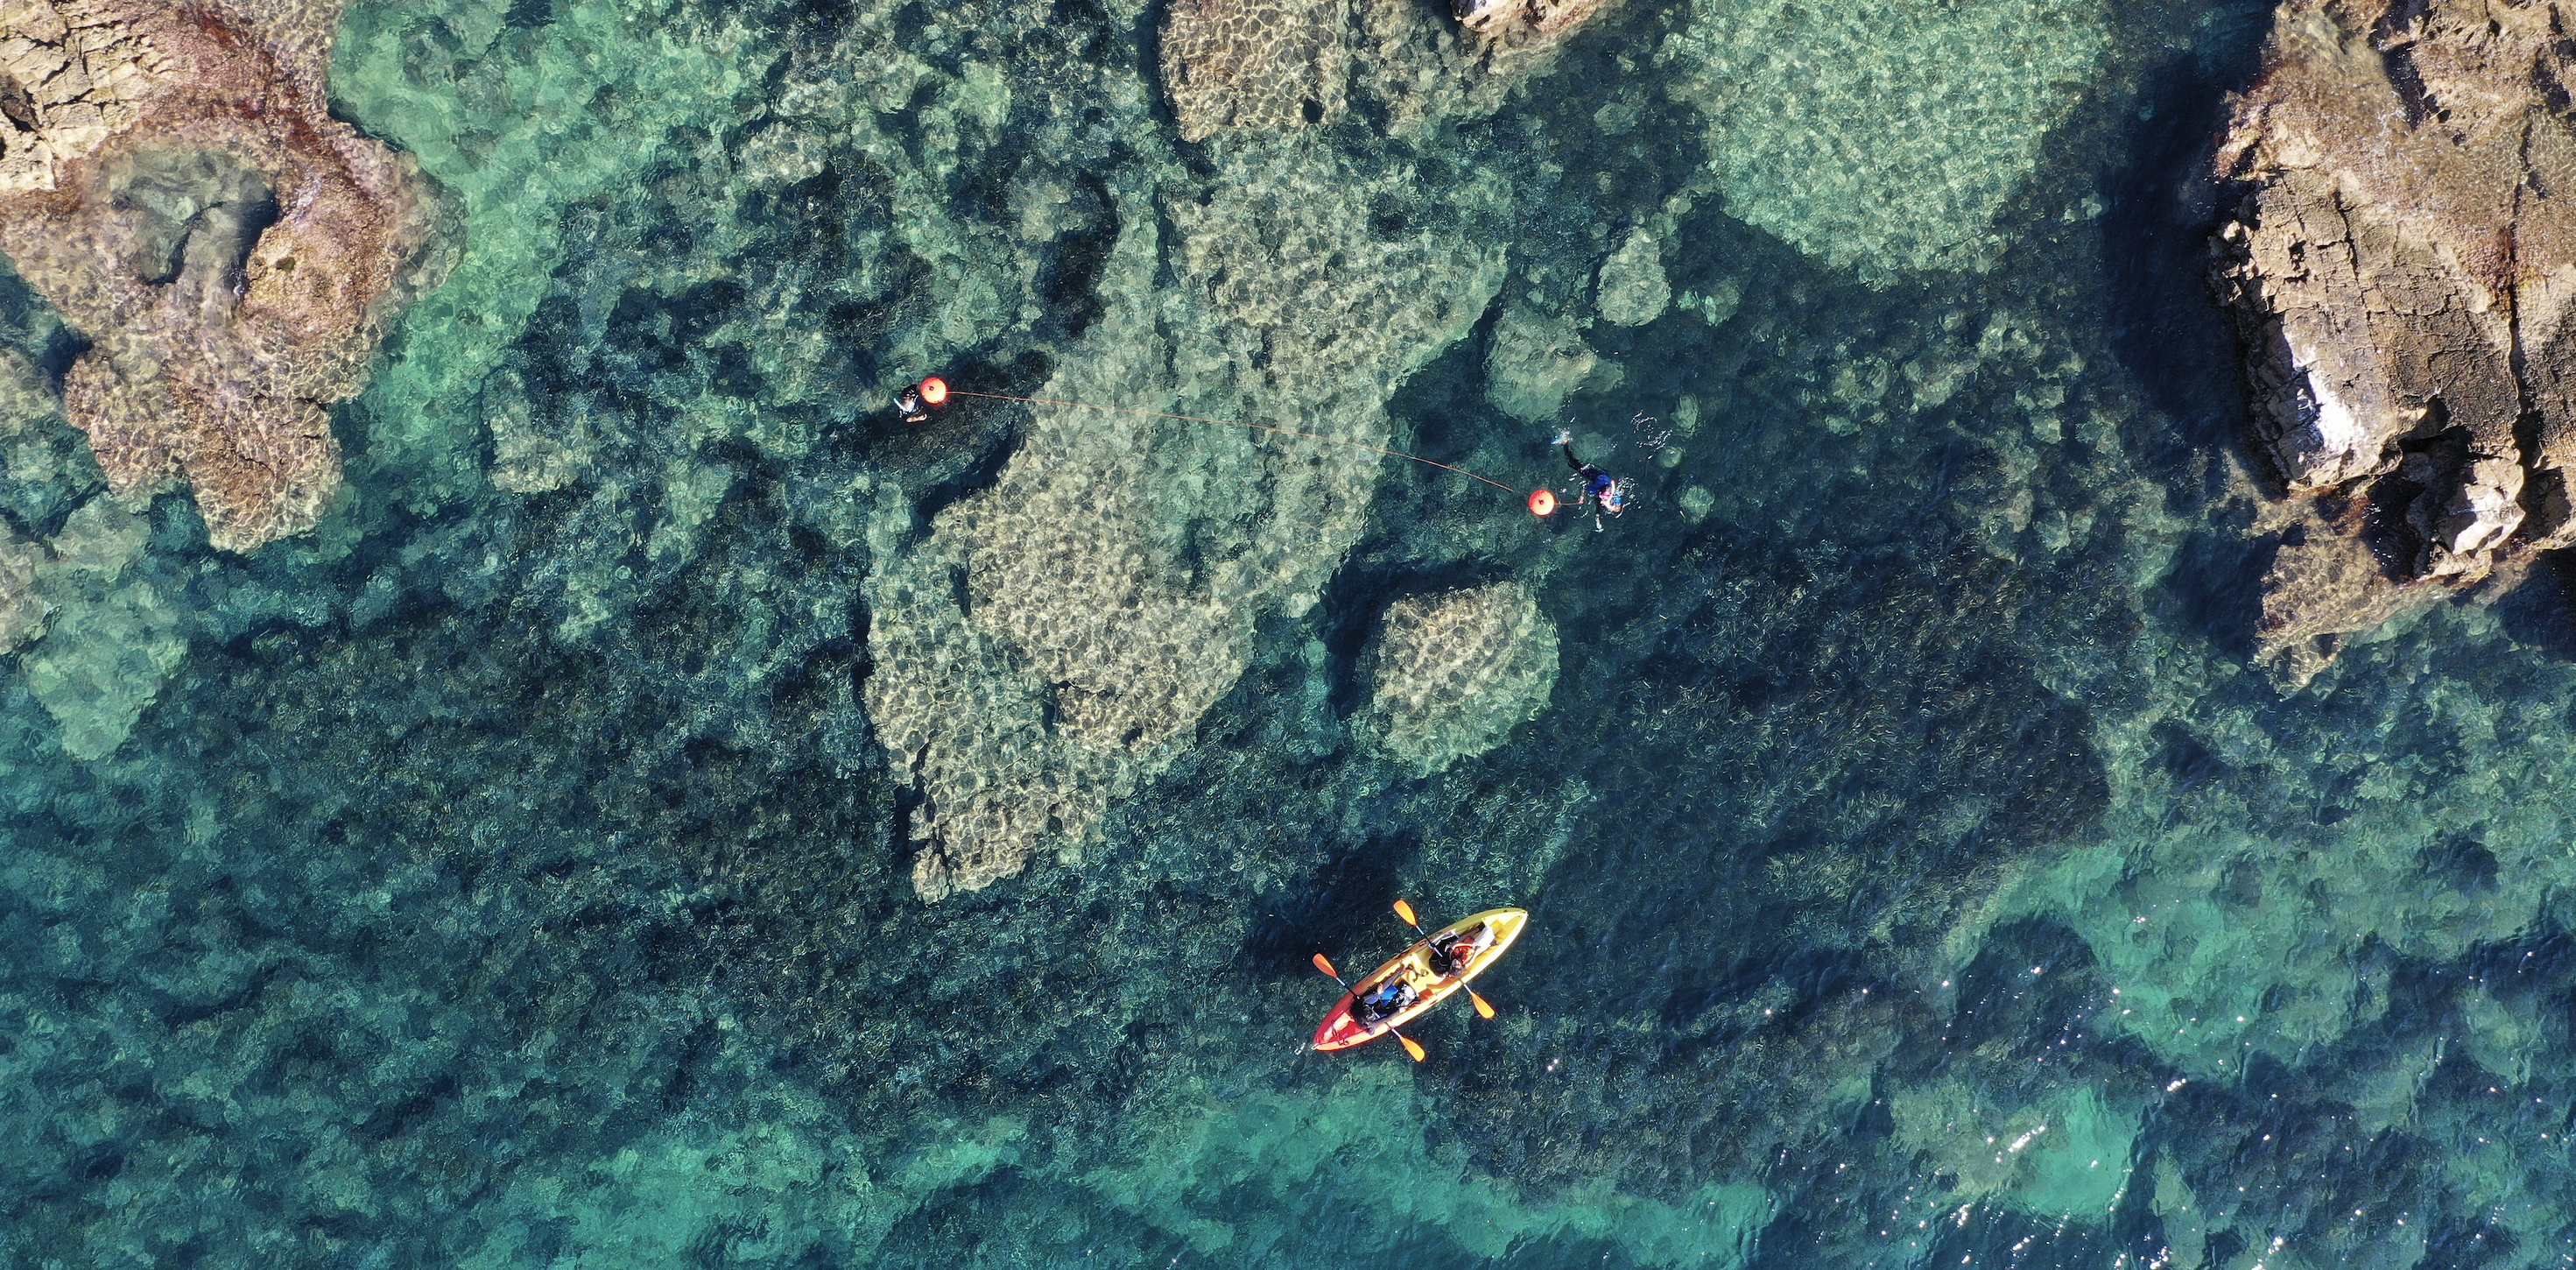
A group of student observers on a station
Leg 1 — Historical monitoring
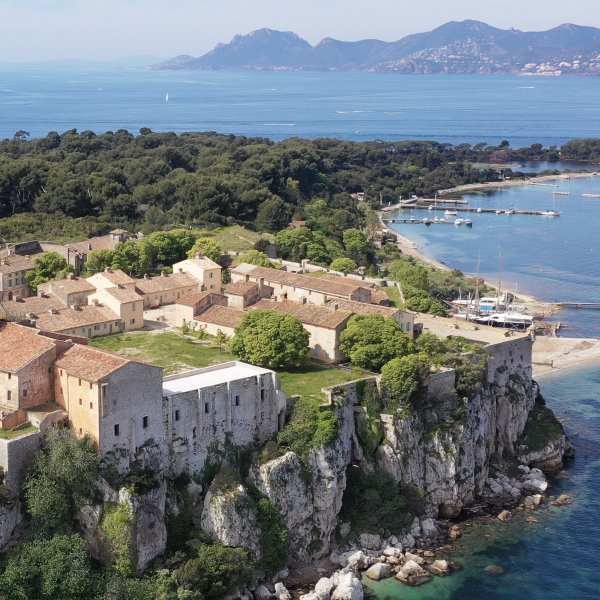
During the September field operations, observers, mostly students from the MSc MARRES programme at Université Côte d’Azur, collect biological and environmental data at sea around the Lérins Islands.
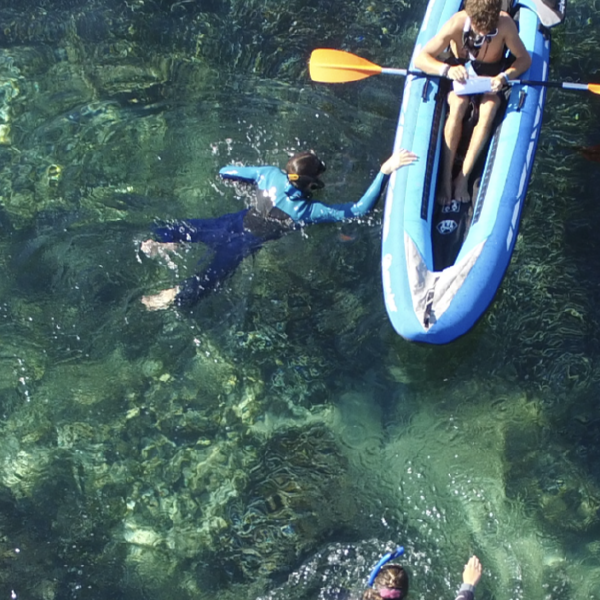
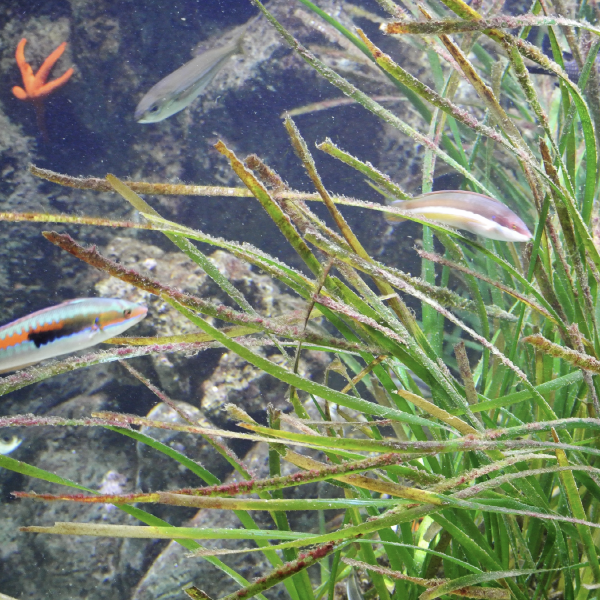
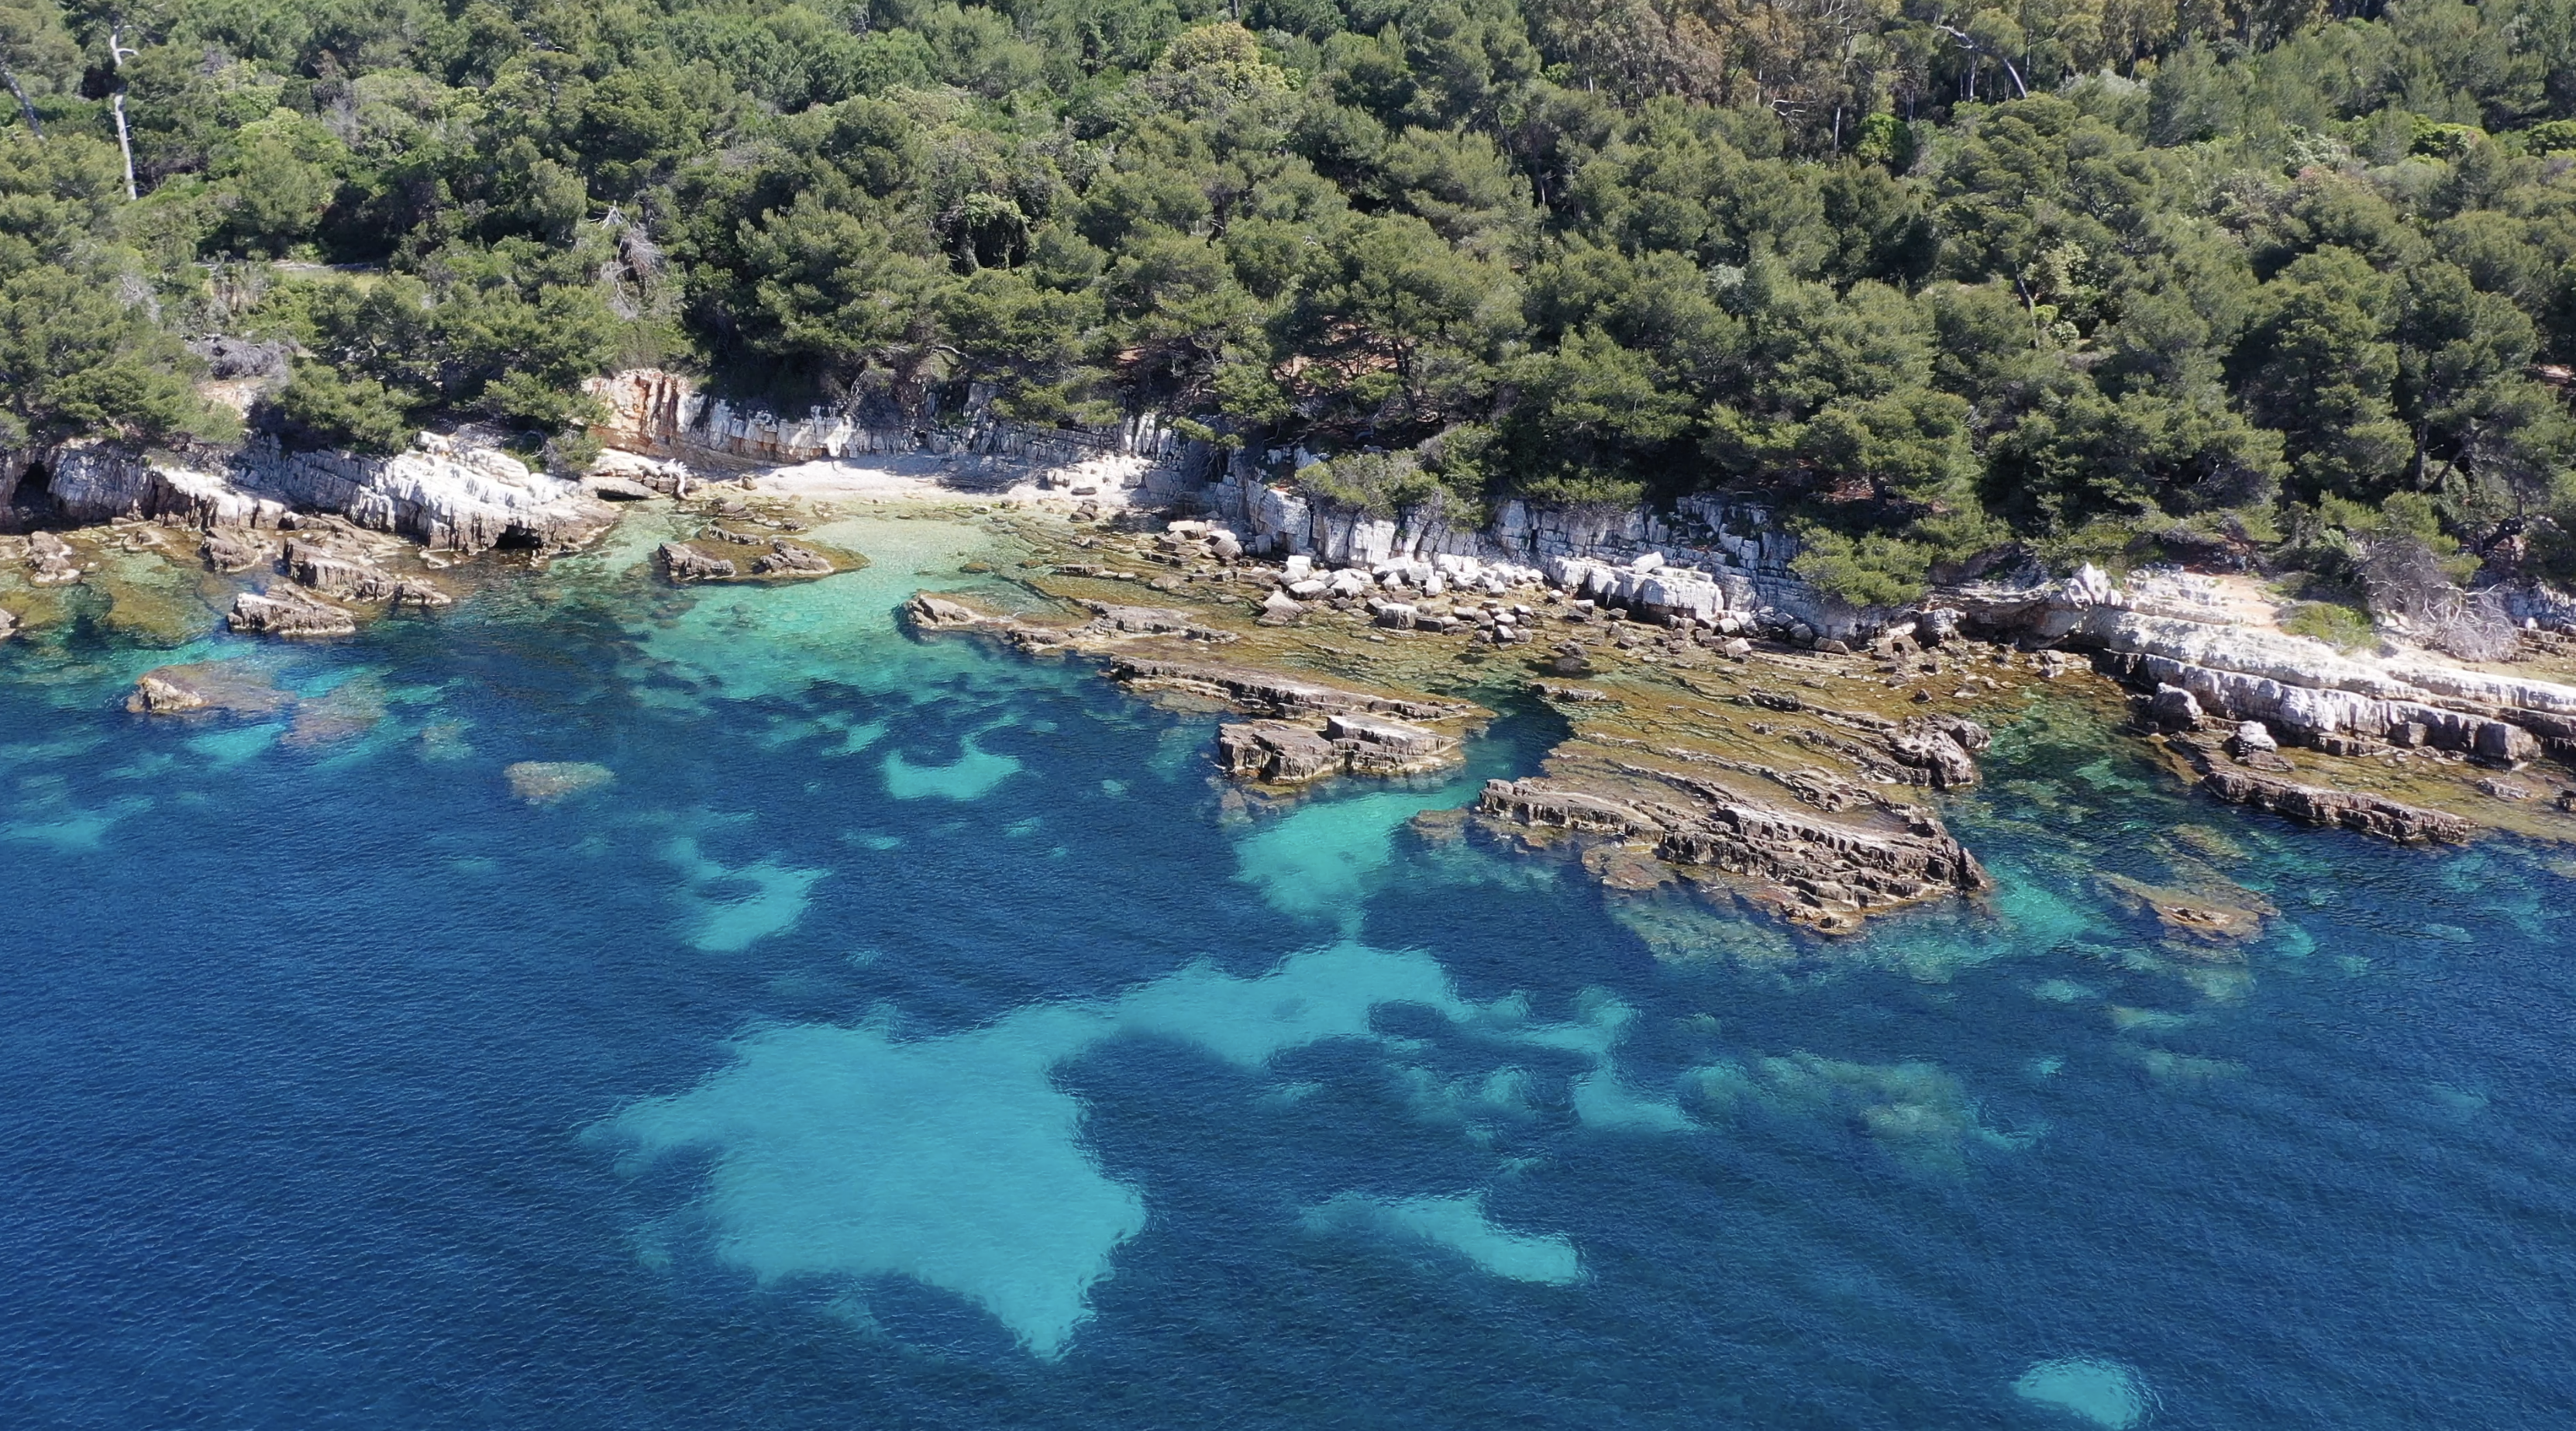
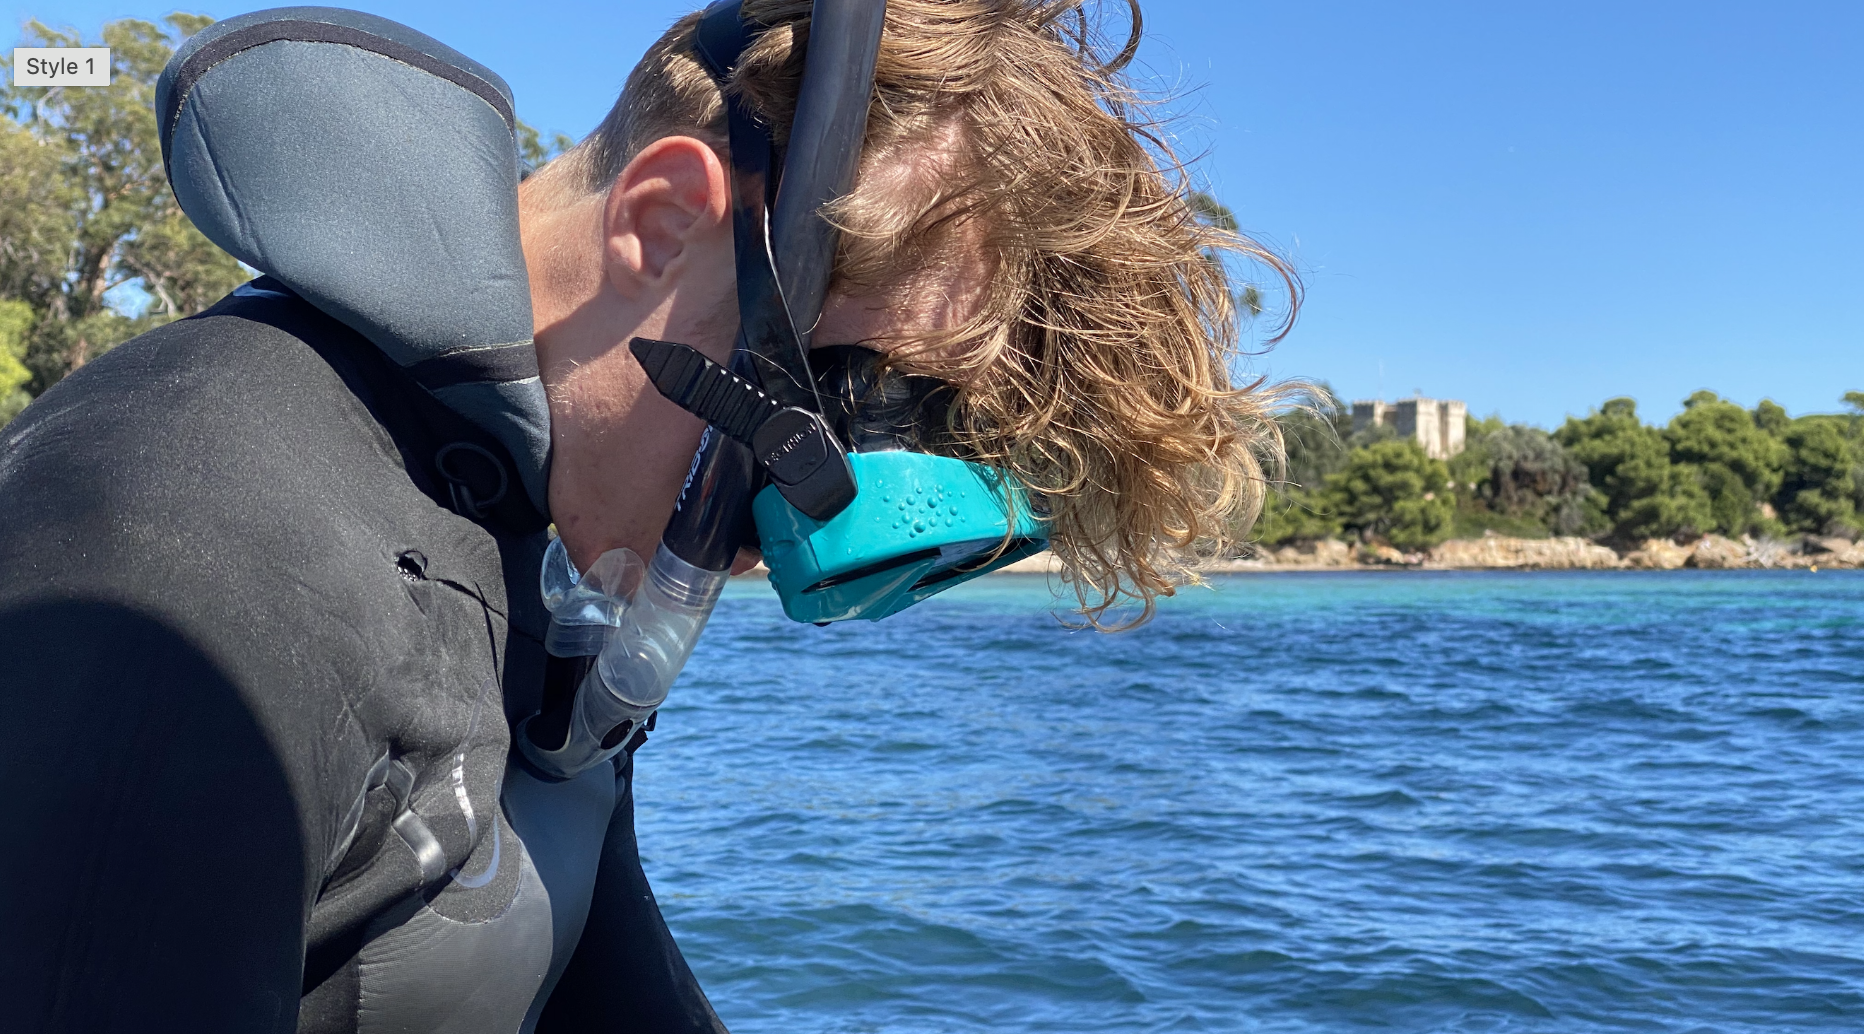
Leg 1 focuses on shoreline biodiversity between 1 and 3 metres deep, corresponding to the depth range that can typically be observed by a snorkeller. Wearing fins, masks and snorkels, they record the abundance of different species across 60 observation stations distributed around the archipelago.
Back on land, students analyse these data as part of their courses and present their results at the end of the academic year to a jury composed of professors, scientists and representatives from local associations. The most motivated students may then deepen their analyses and work with members of the jury to prepare annual reports and communication tools for different audiences.
What is sampling?
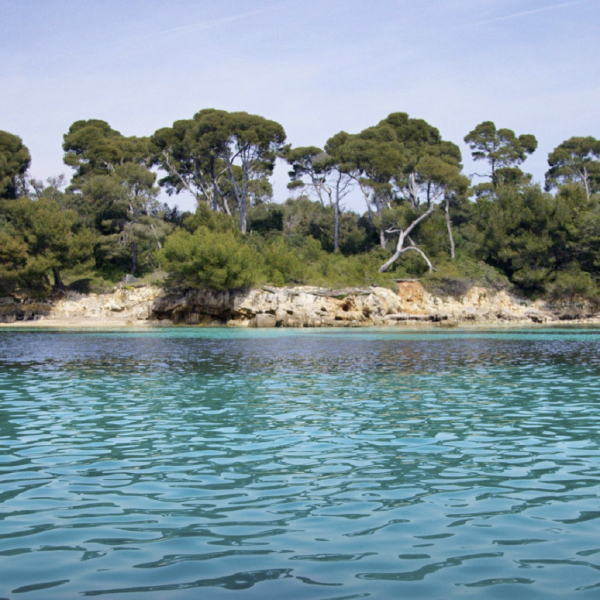
The Lérins archipelago has approximately 12 km of coastline, with a complex and irregular shoreline. Counting every fish or every organism along this entire coastline would be unrealistic.
Sampling is based on a simple idea: to understand a whole system by studying a representative part of it. This principle is central to inferential statistics. More than a century ago, William Gosset applied this logic while working on the quality of Guinness beer: rather than testing every single barrel, he developed statistical approaches to draw reliable conclusions from samples.
Around the Lérins Islands, the chosen strategy is to count the number of individuals of observable species within a 10 m × 3 m area. This area is called an observation station (or transect). In total, 60 stations of 30 m² are distributed approximately every 200 m along the coastline.
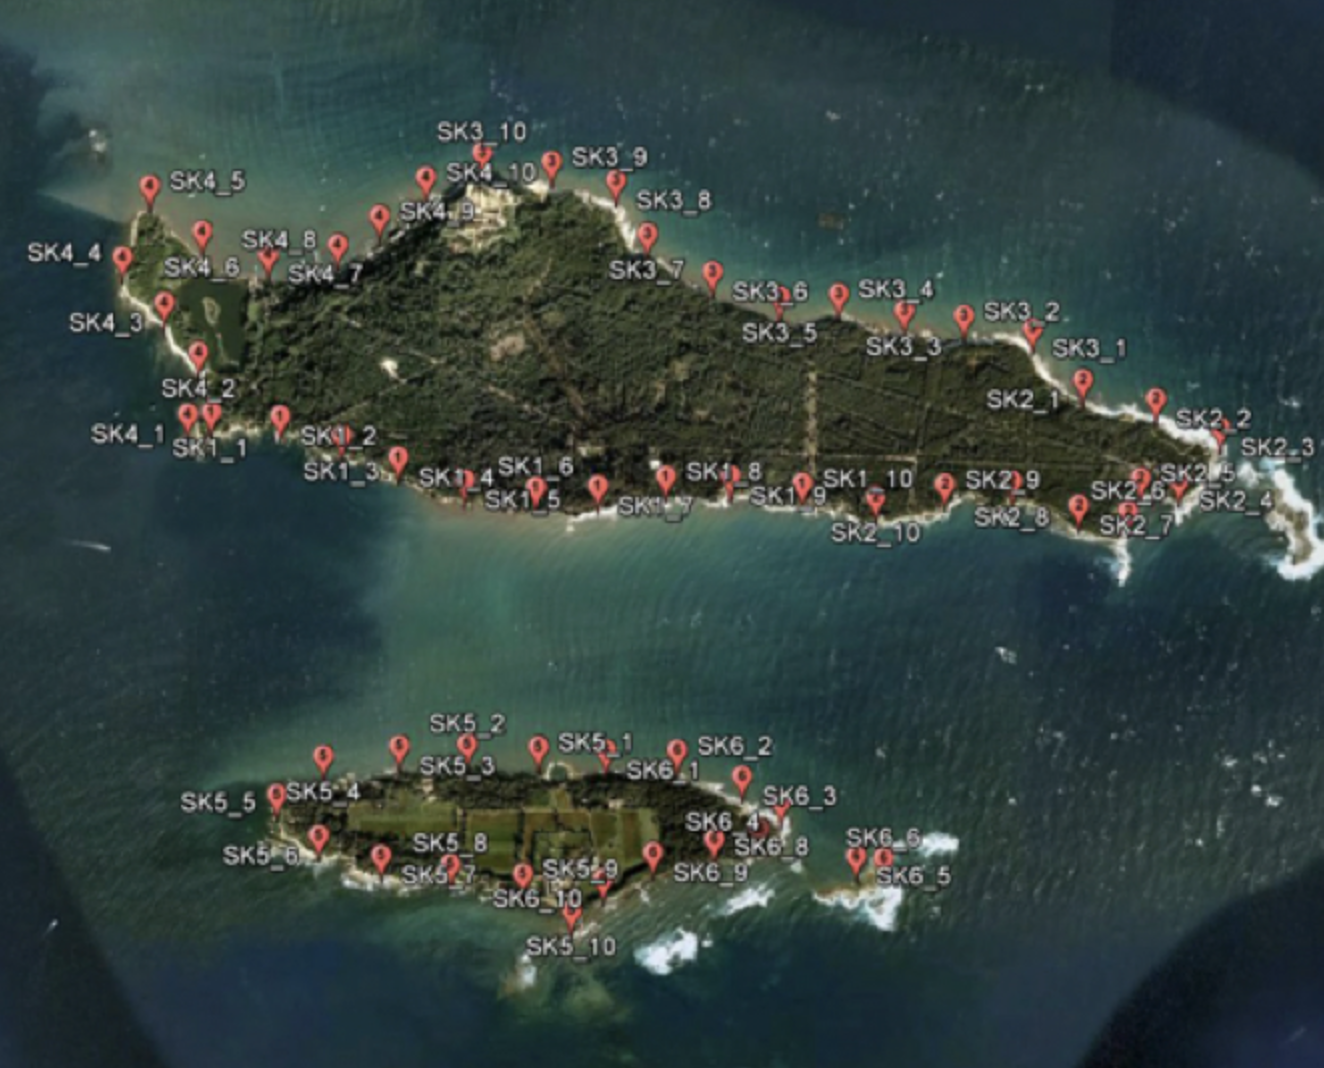
Organisation in the field
Since 2012, the fieldwork has been organised around six teams each year, with each team responsible for 10 stations.
Following a strict protocol, students count the number of individuals of each species observed at each station. They also record key environmental features, such as bottom type, habitat structure and visible human pressures.
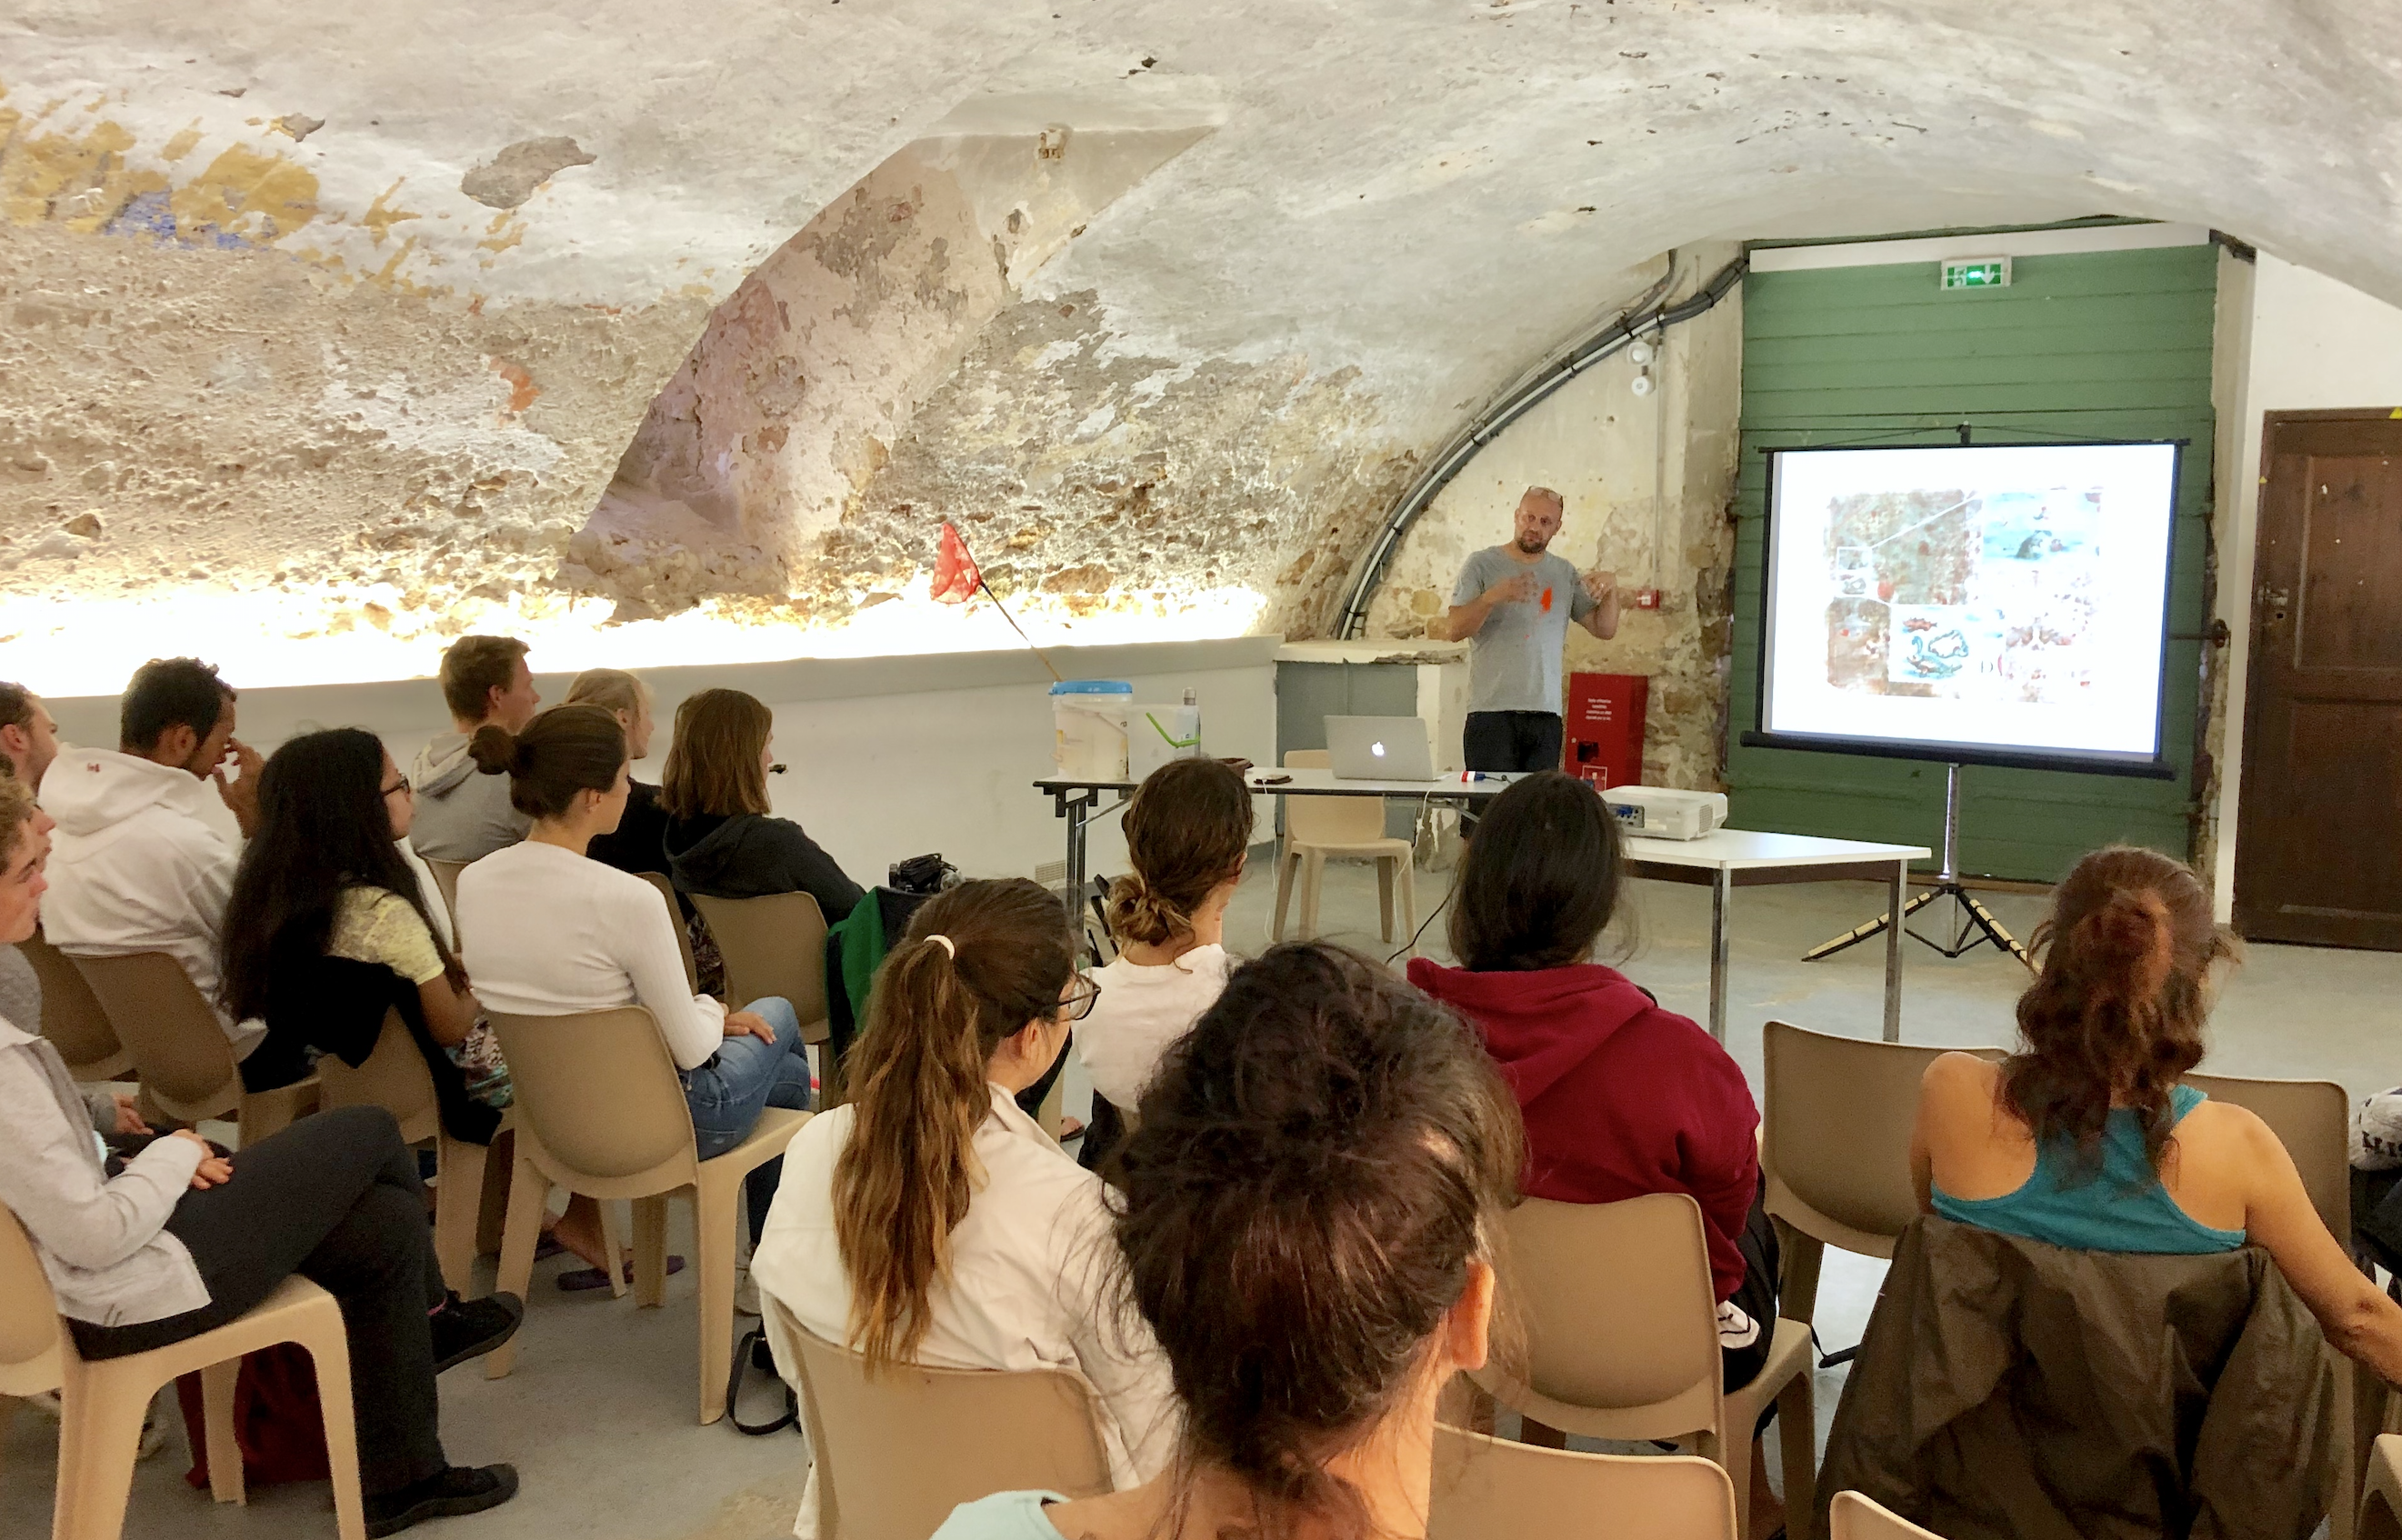
General briefing on the islands
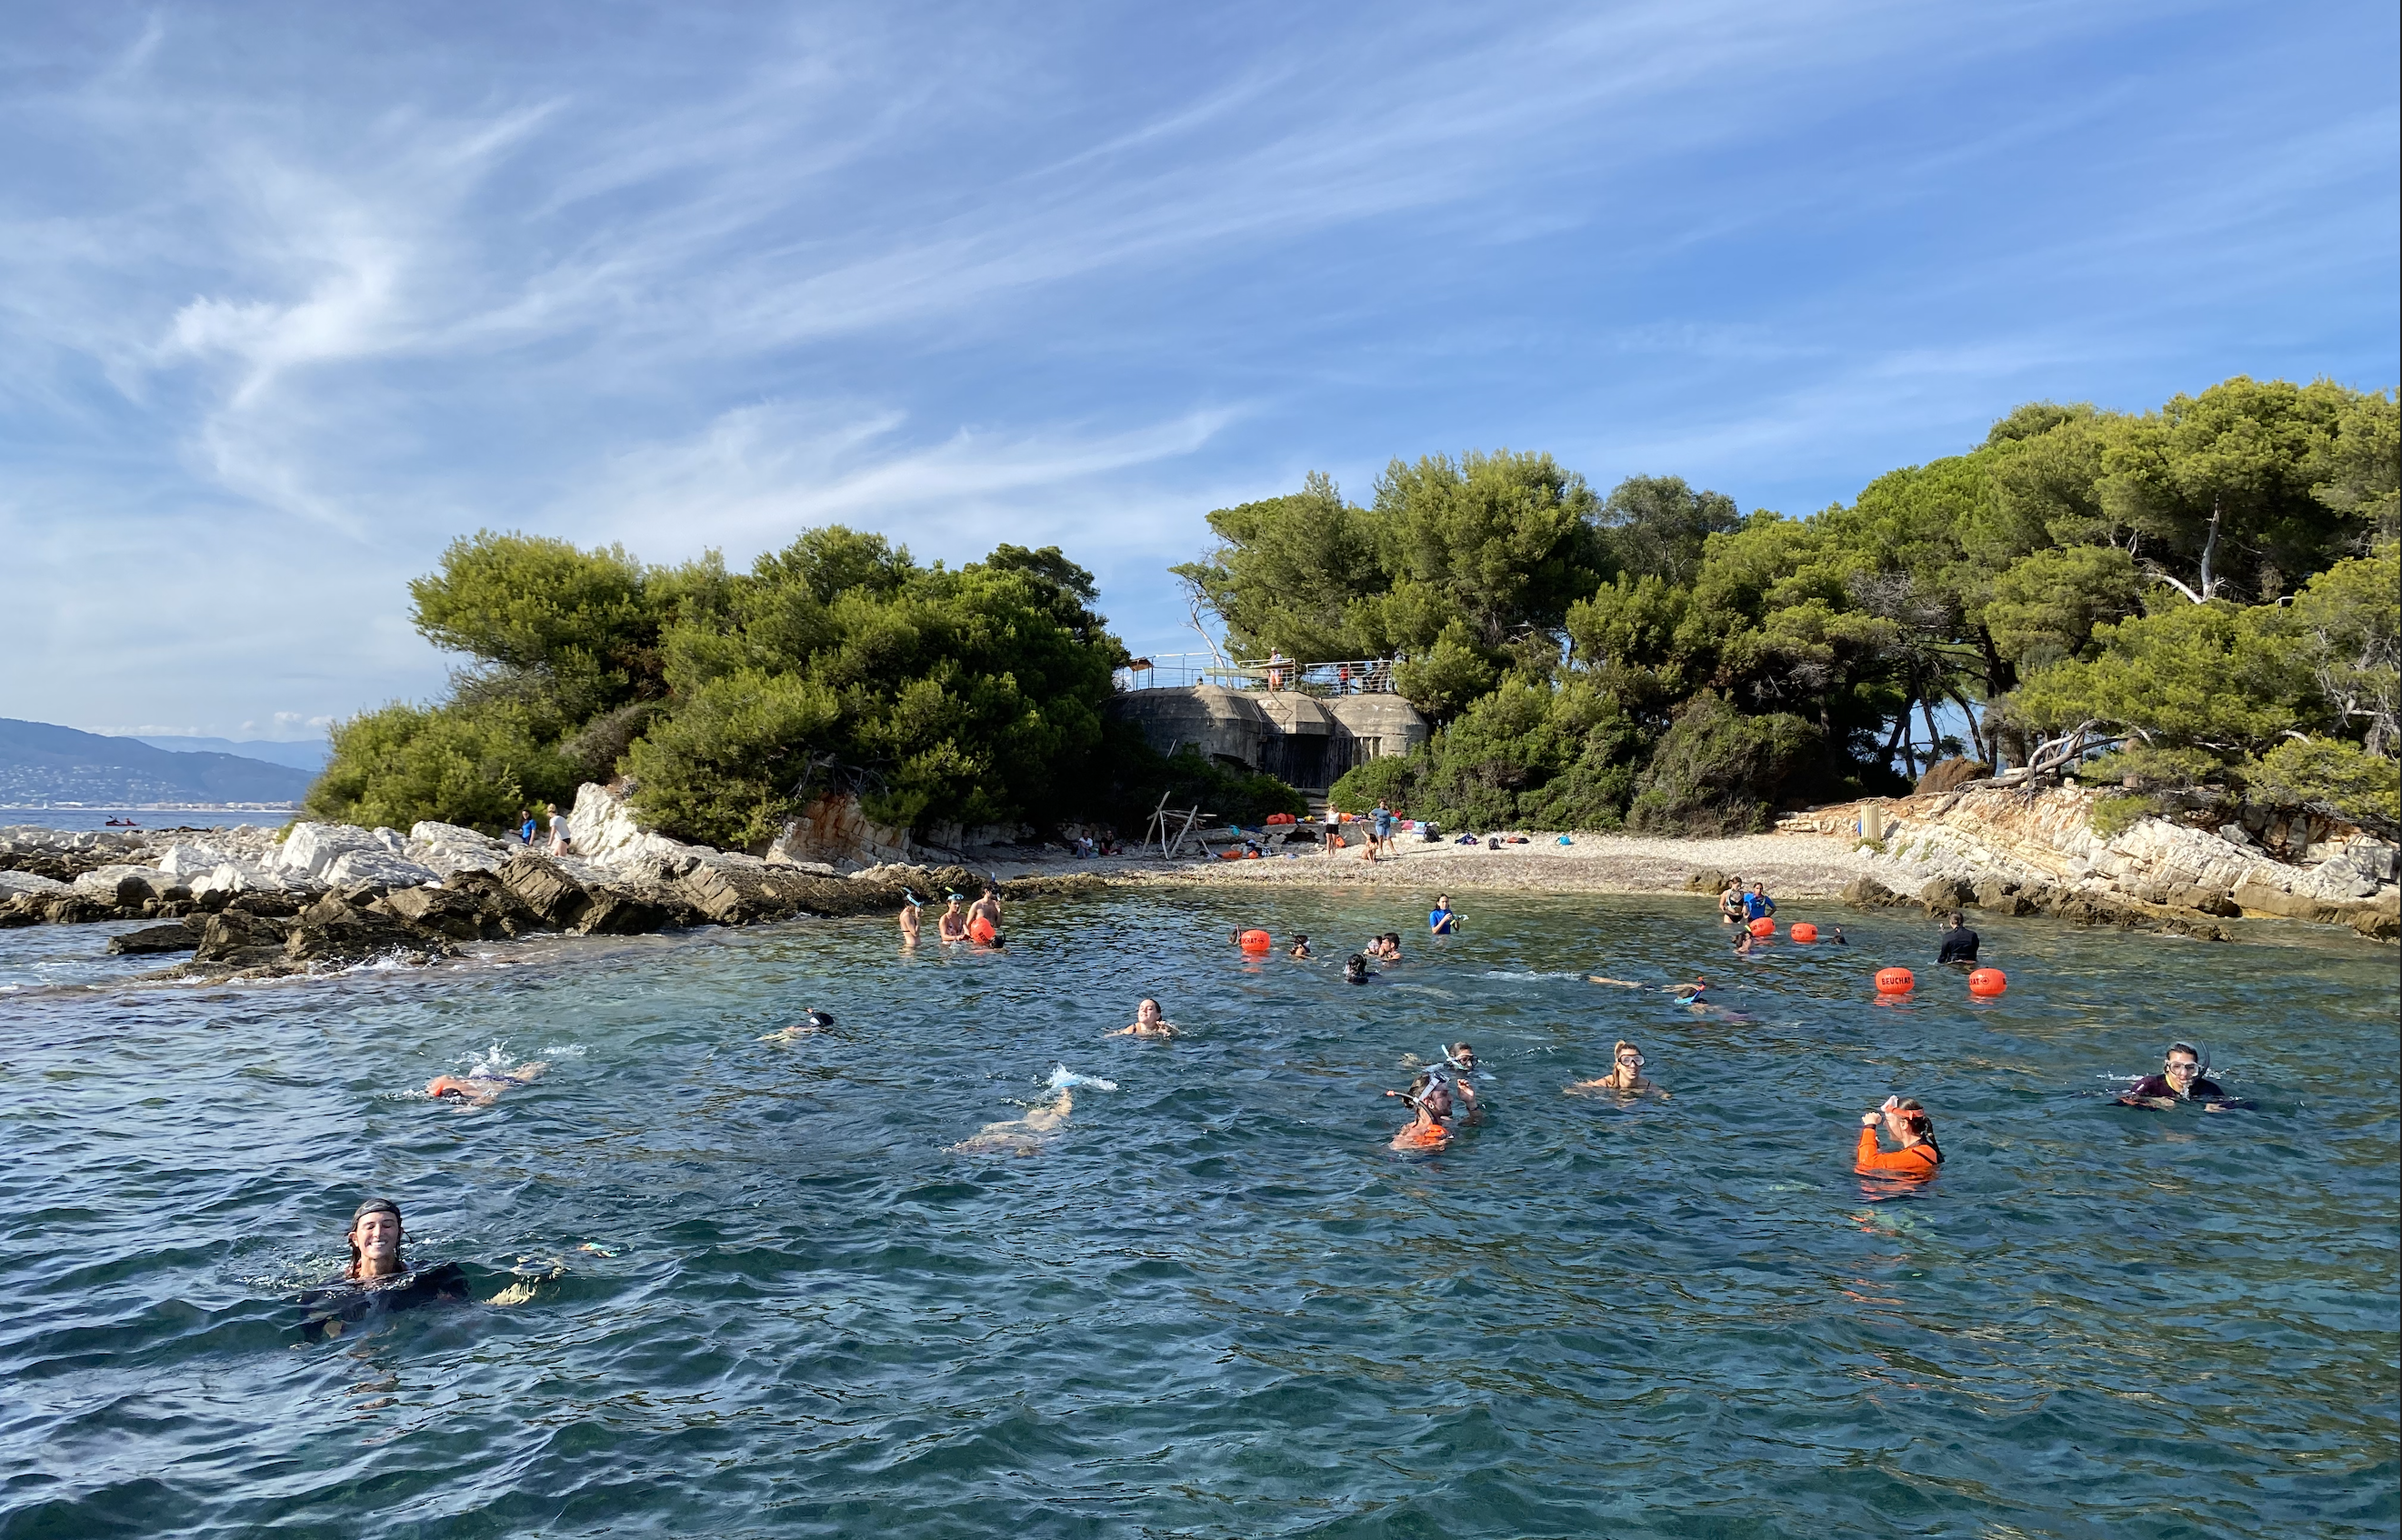 Training session to test the material... and the observers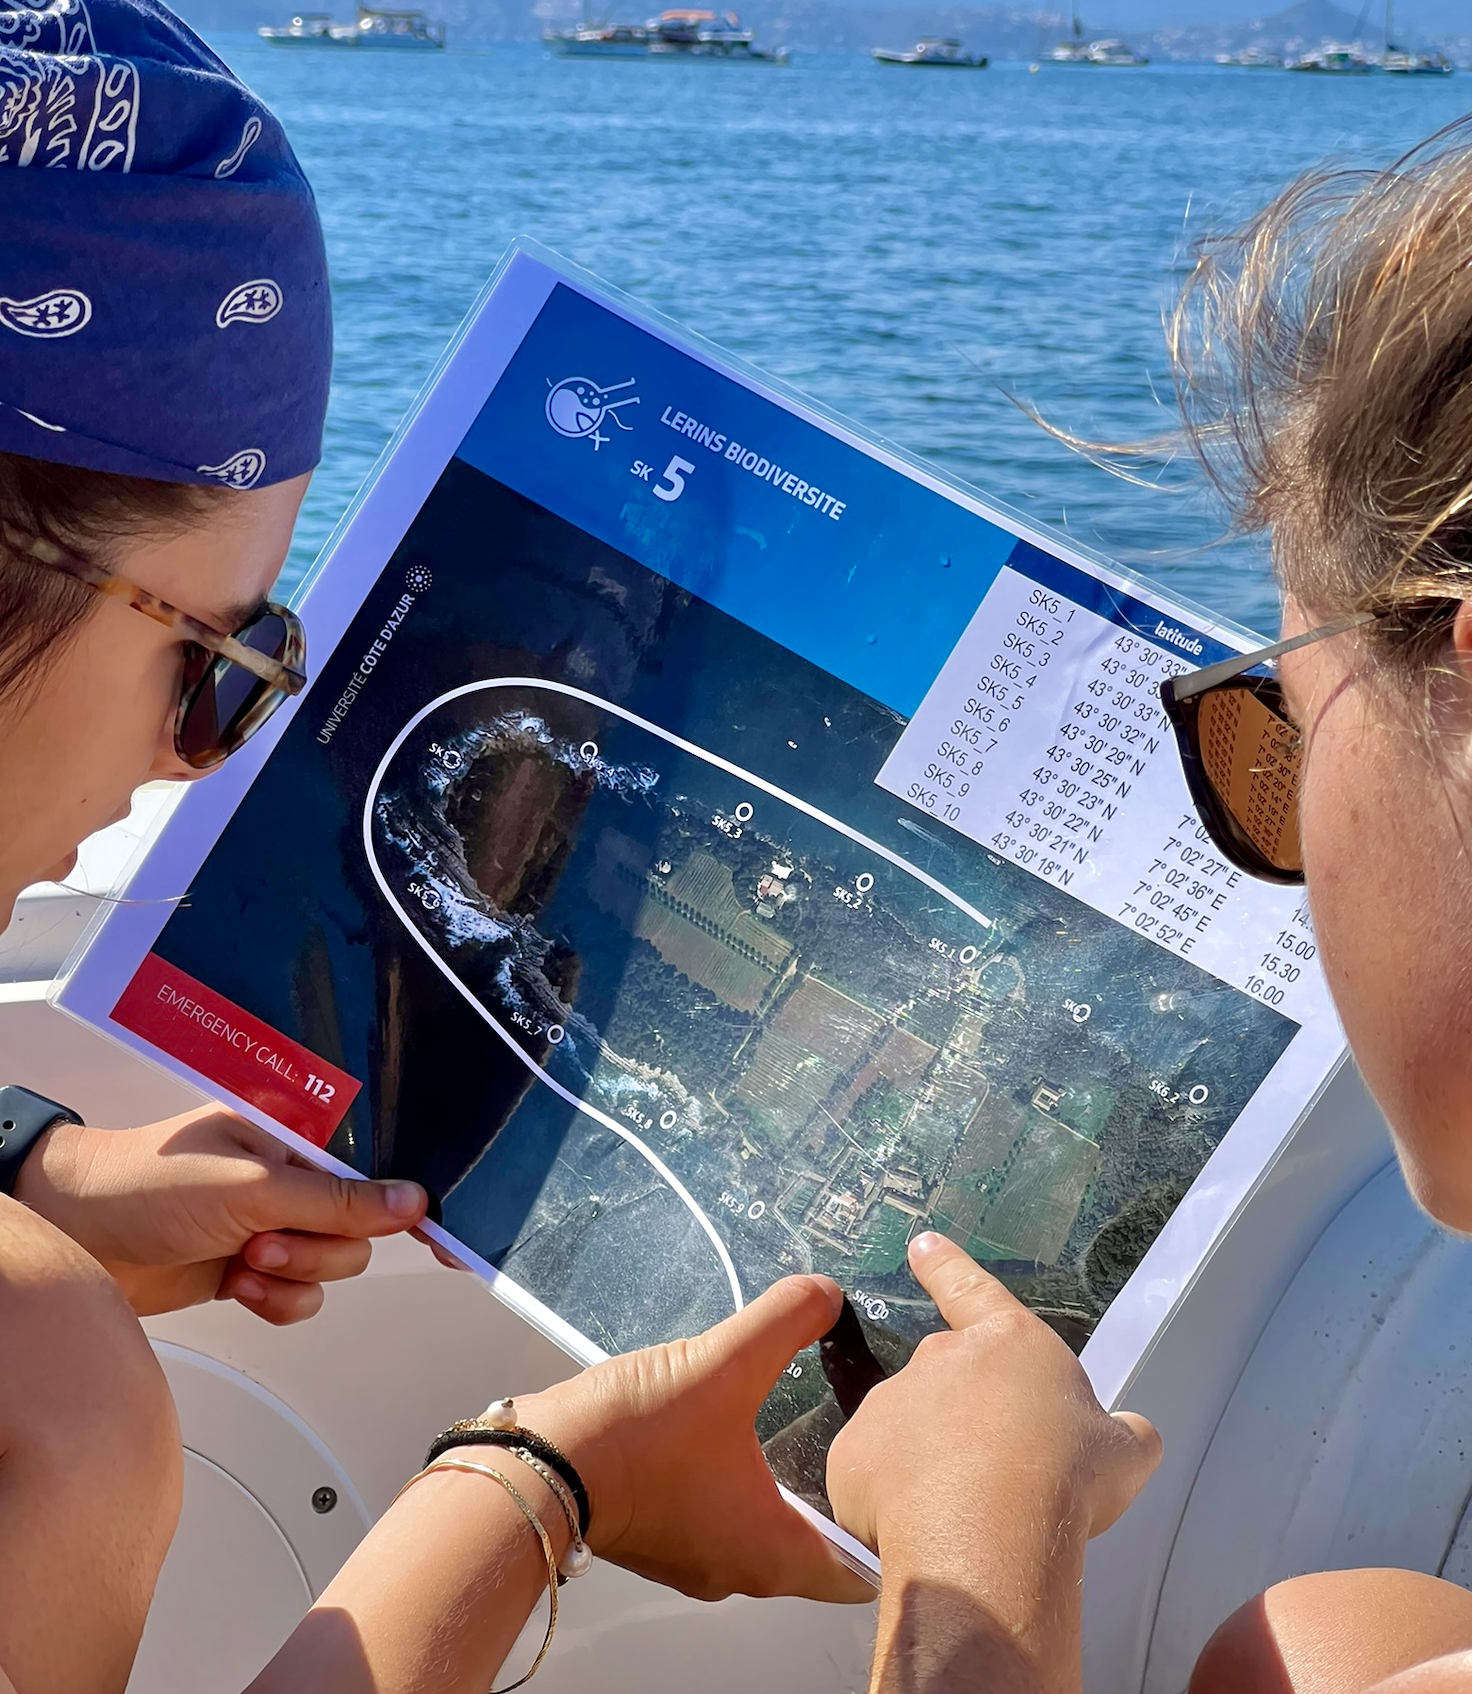
Recon session to identify the different sites and learn how to locate them
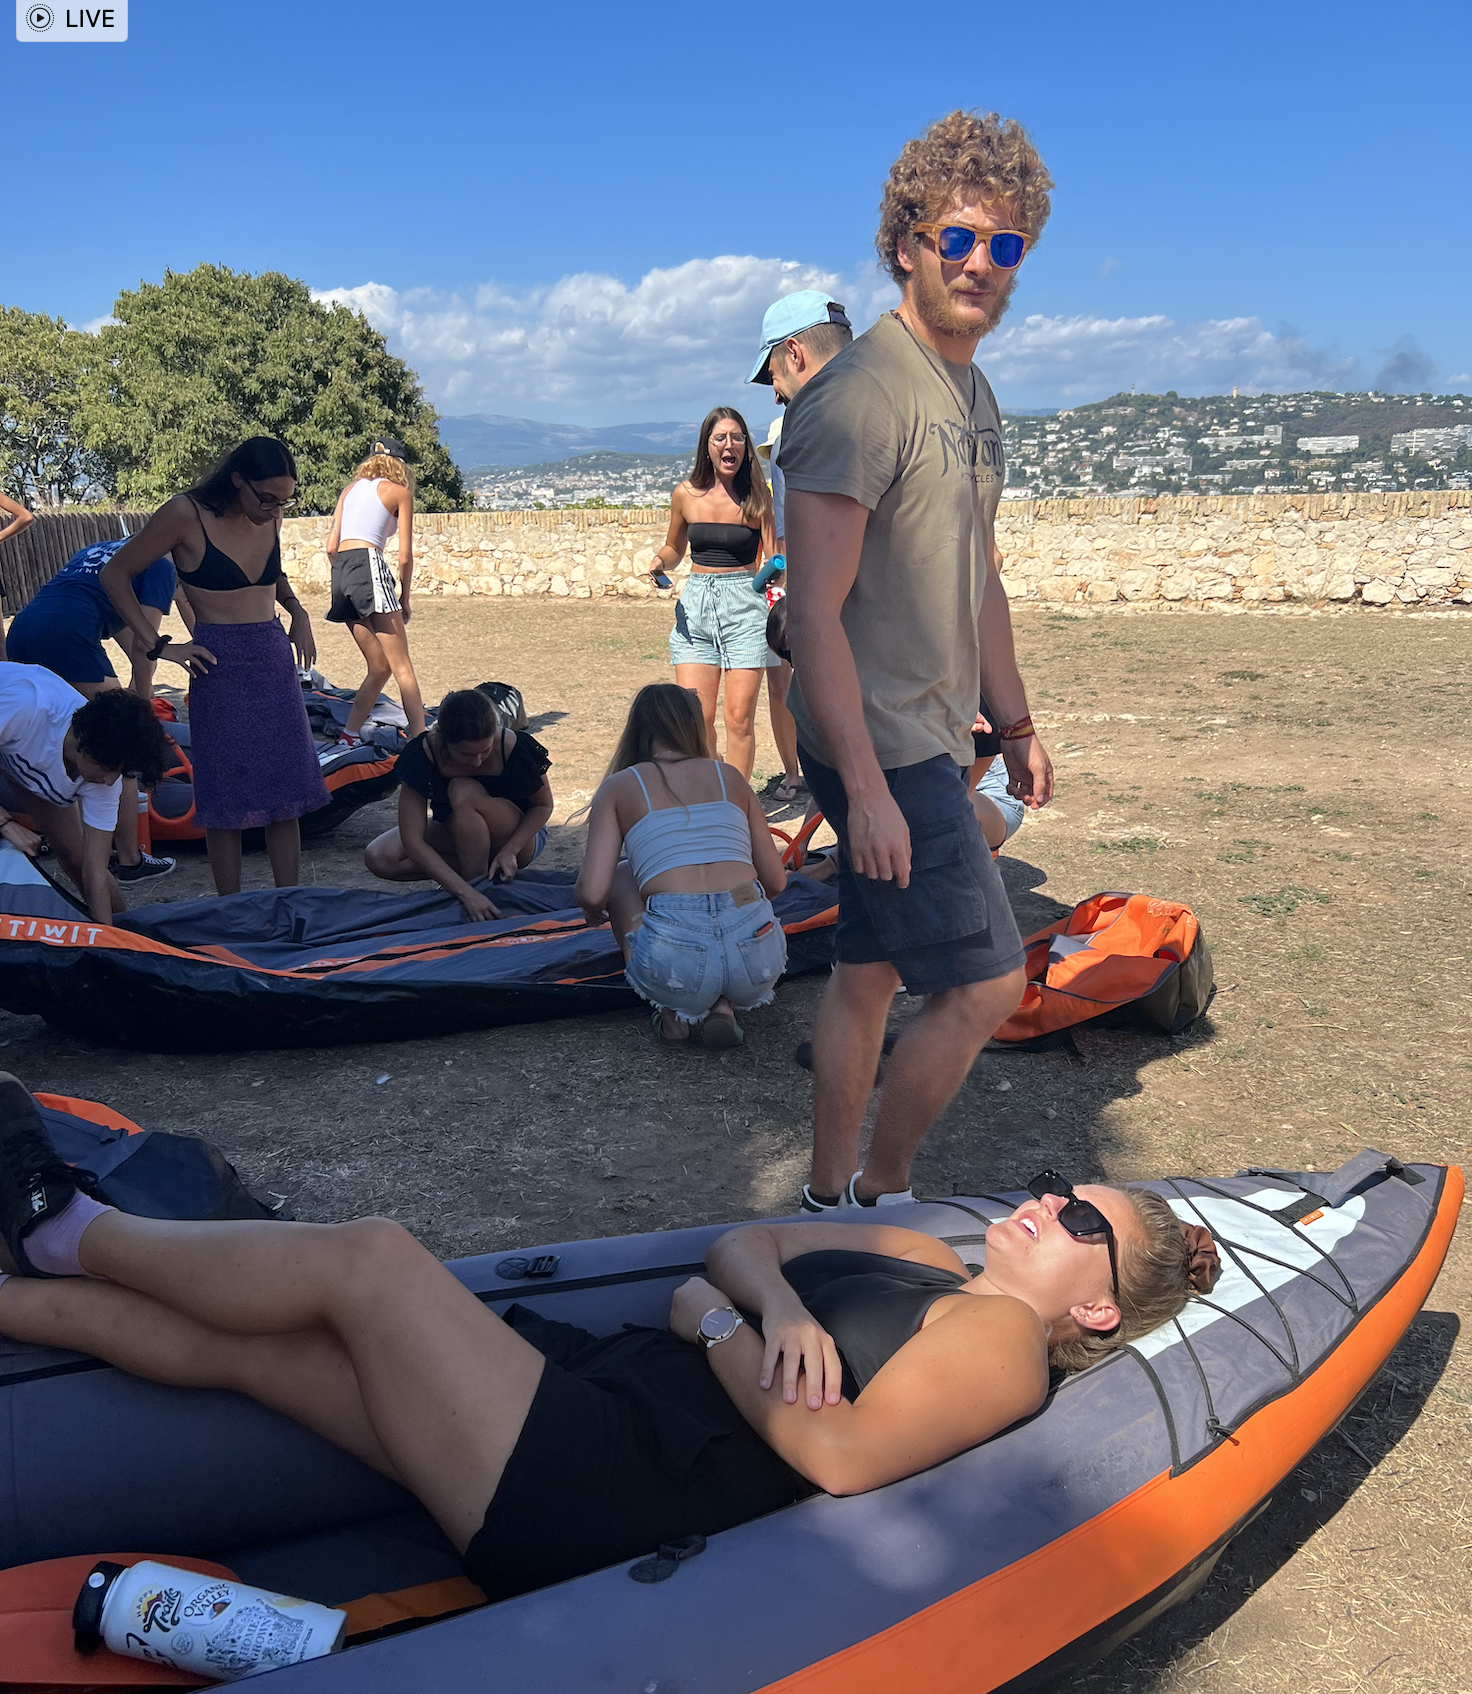
Preparation of the material leaded by the Y2s
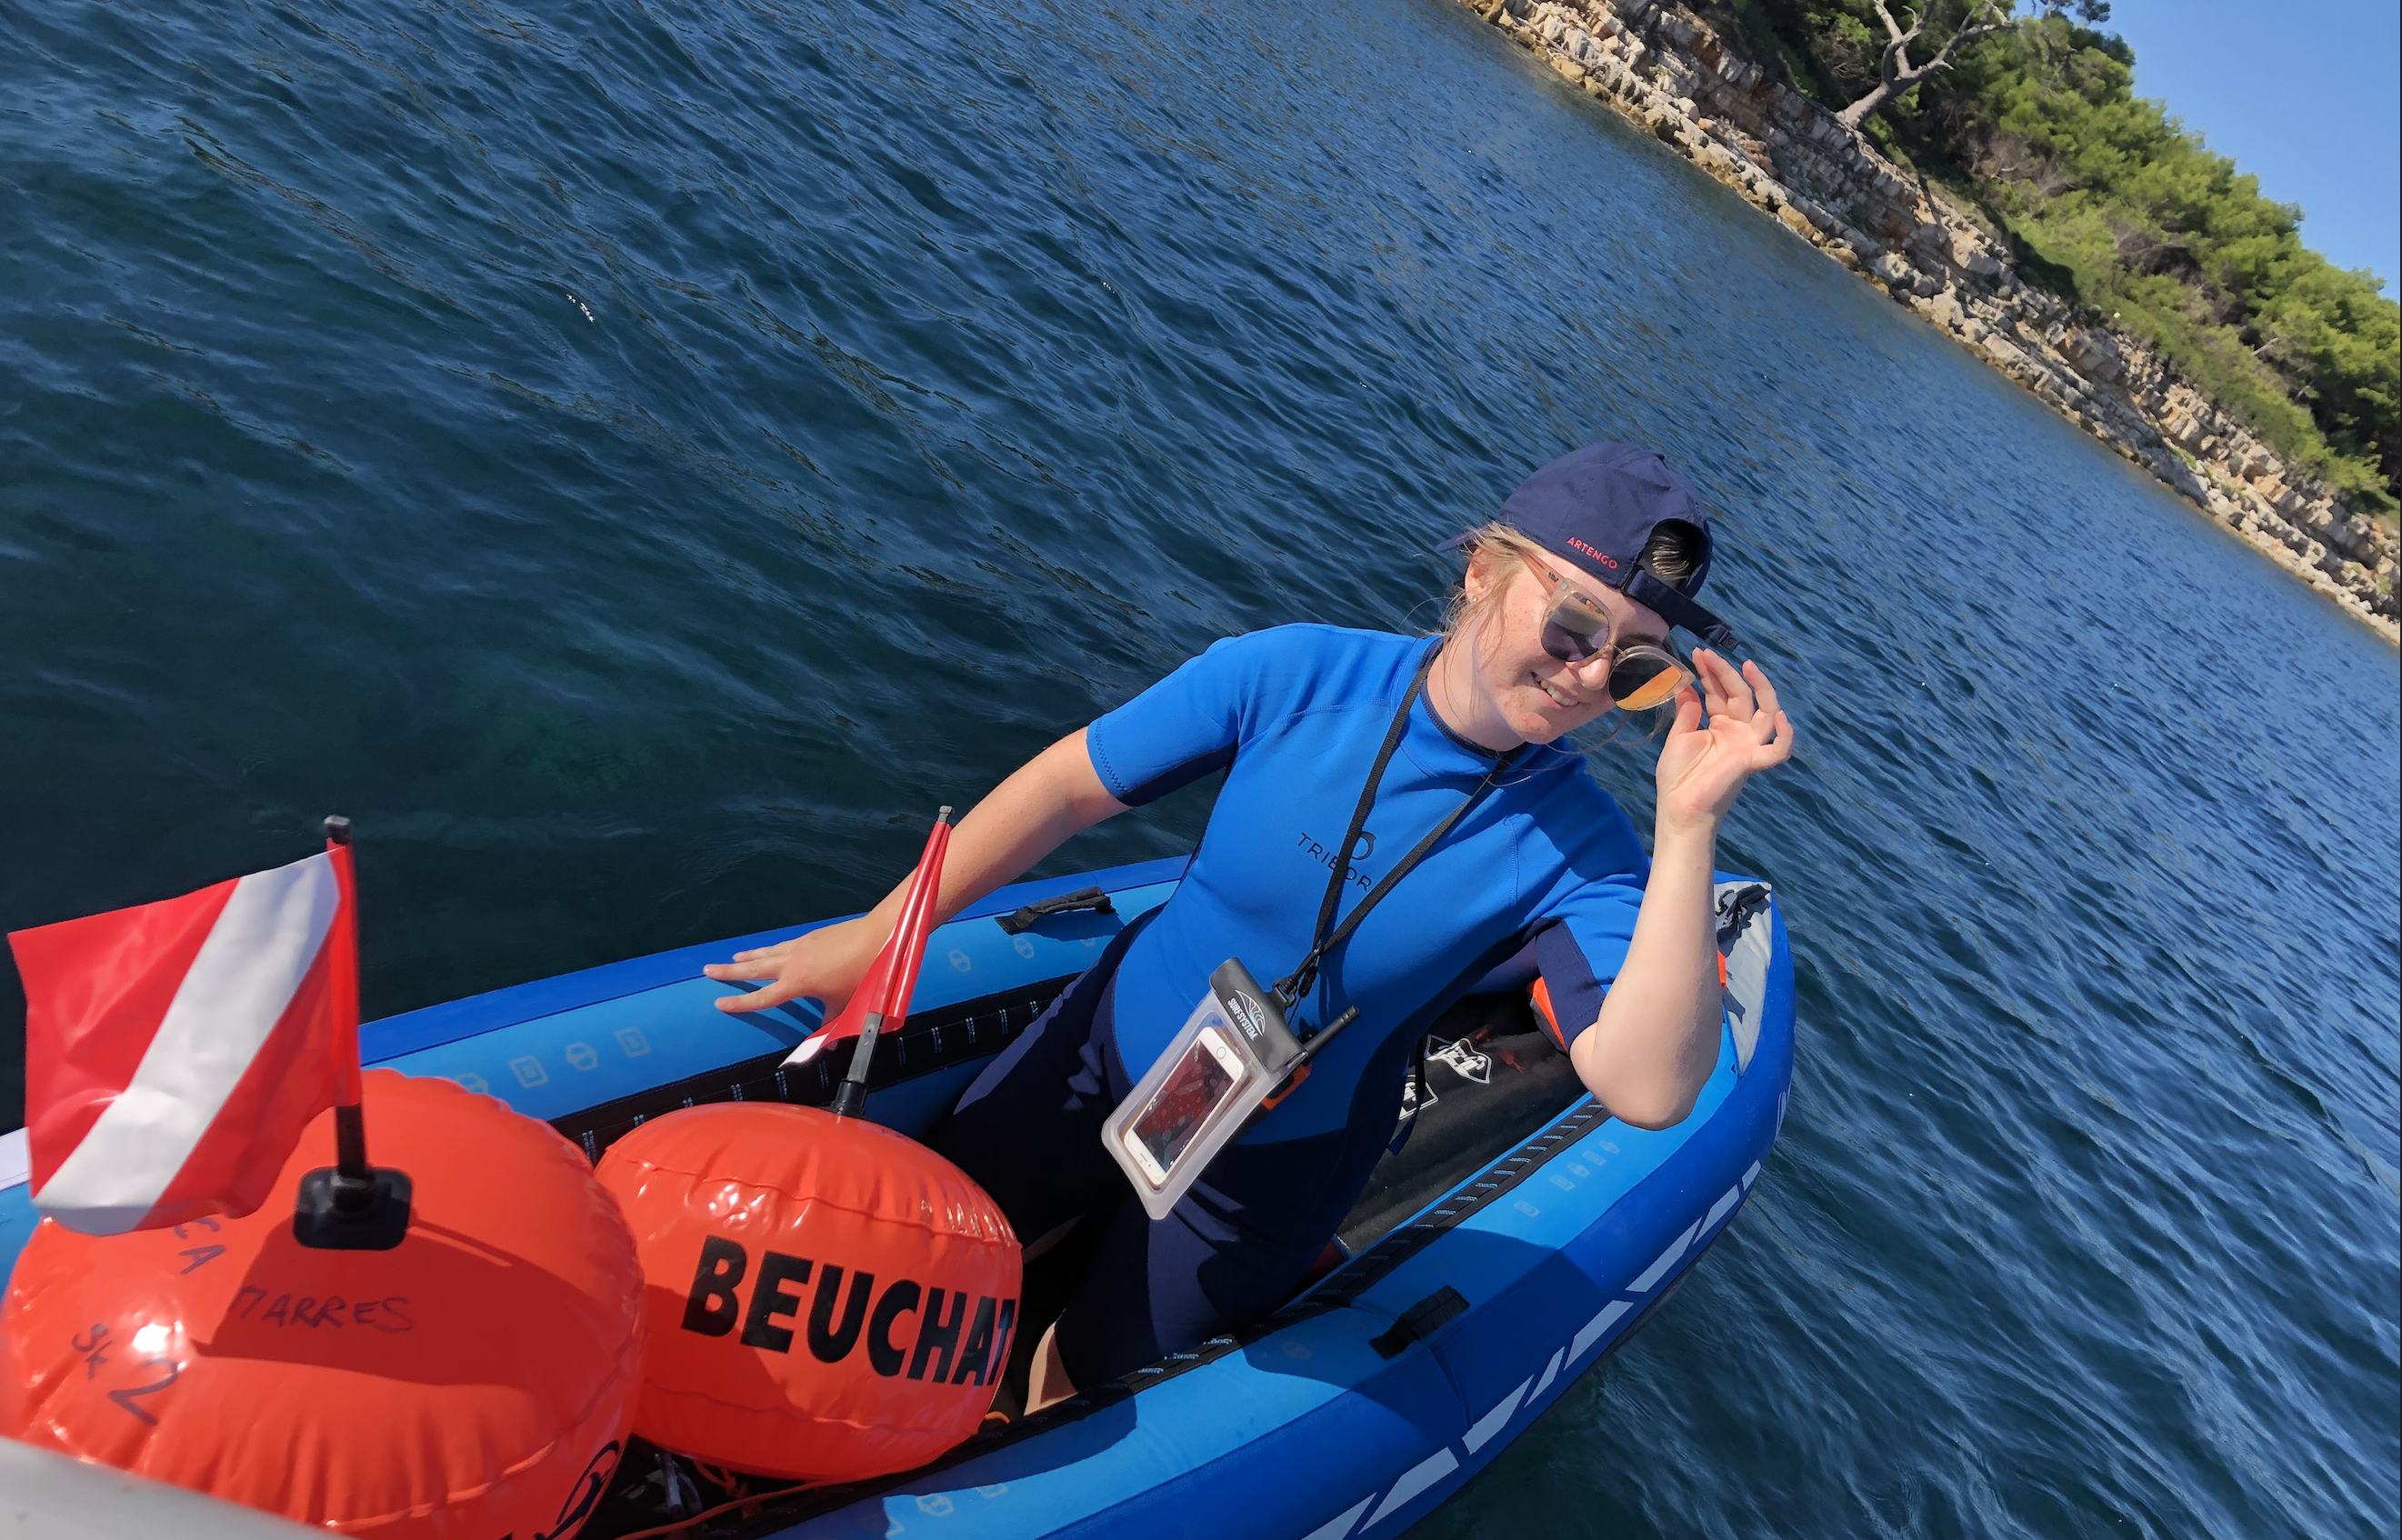
The different teams get in position to start leg 1
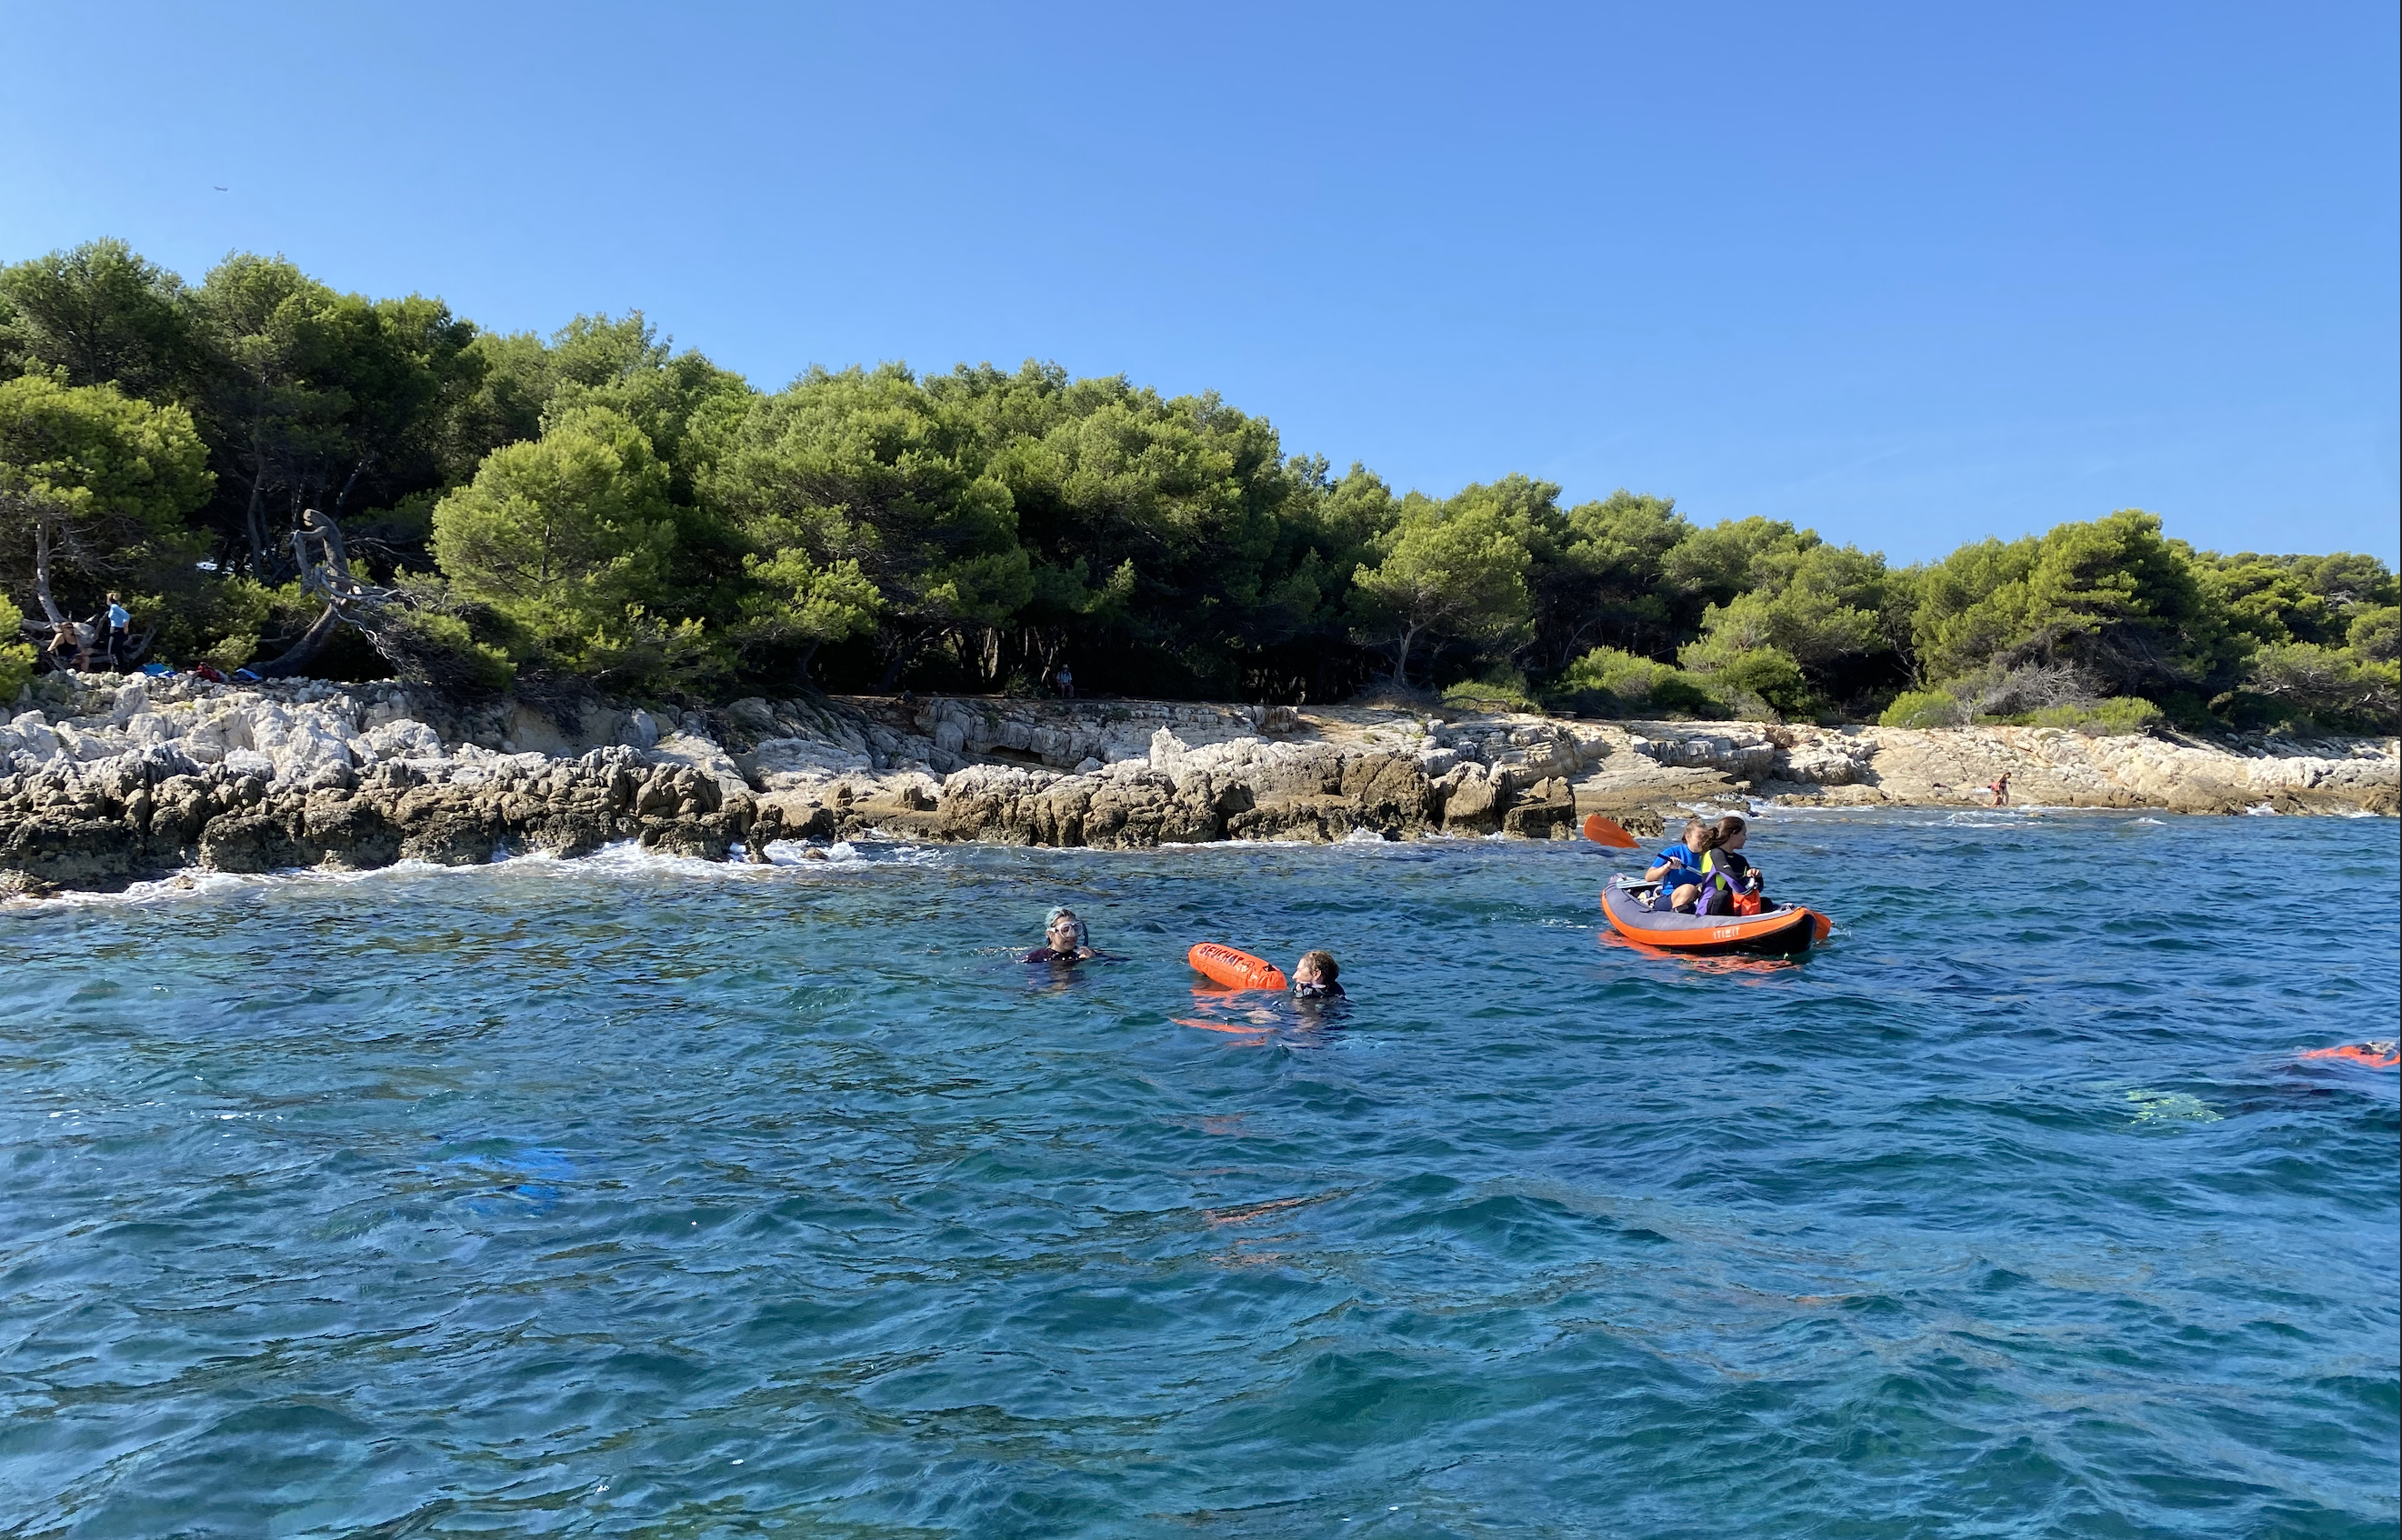
During the operations of leg 1
.
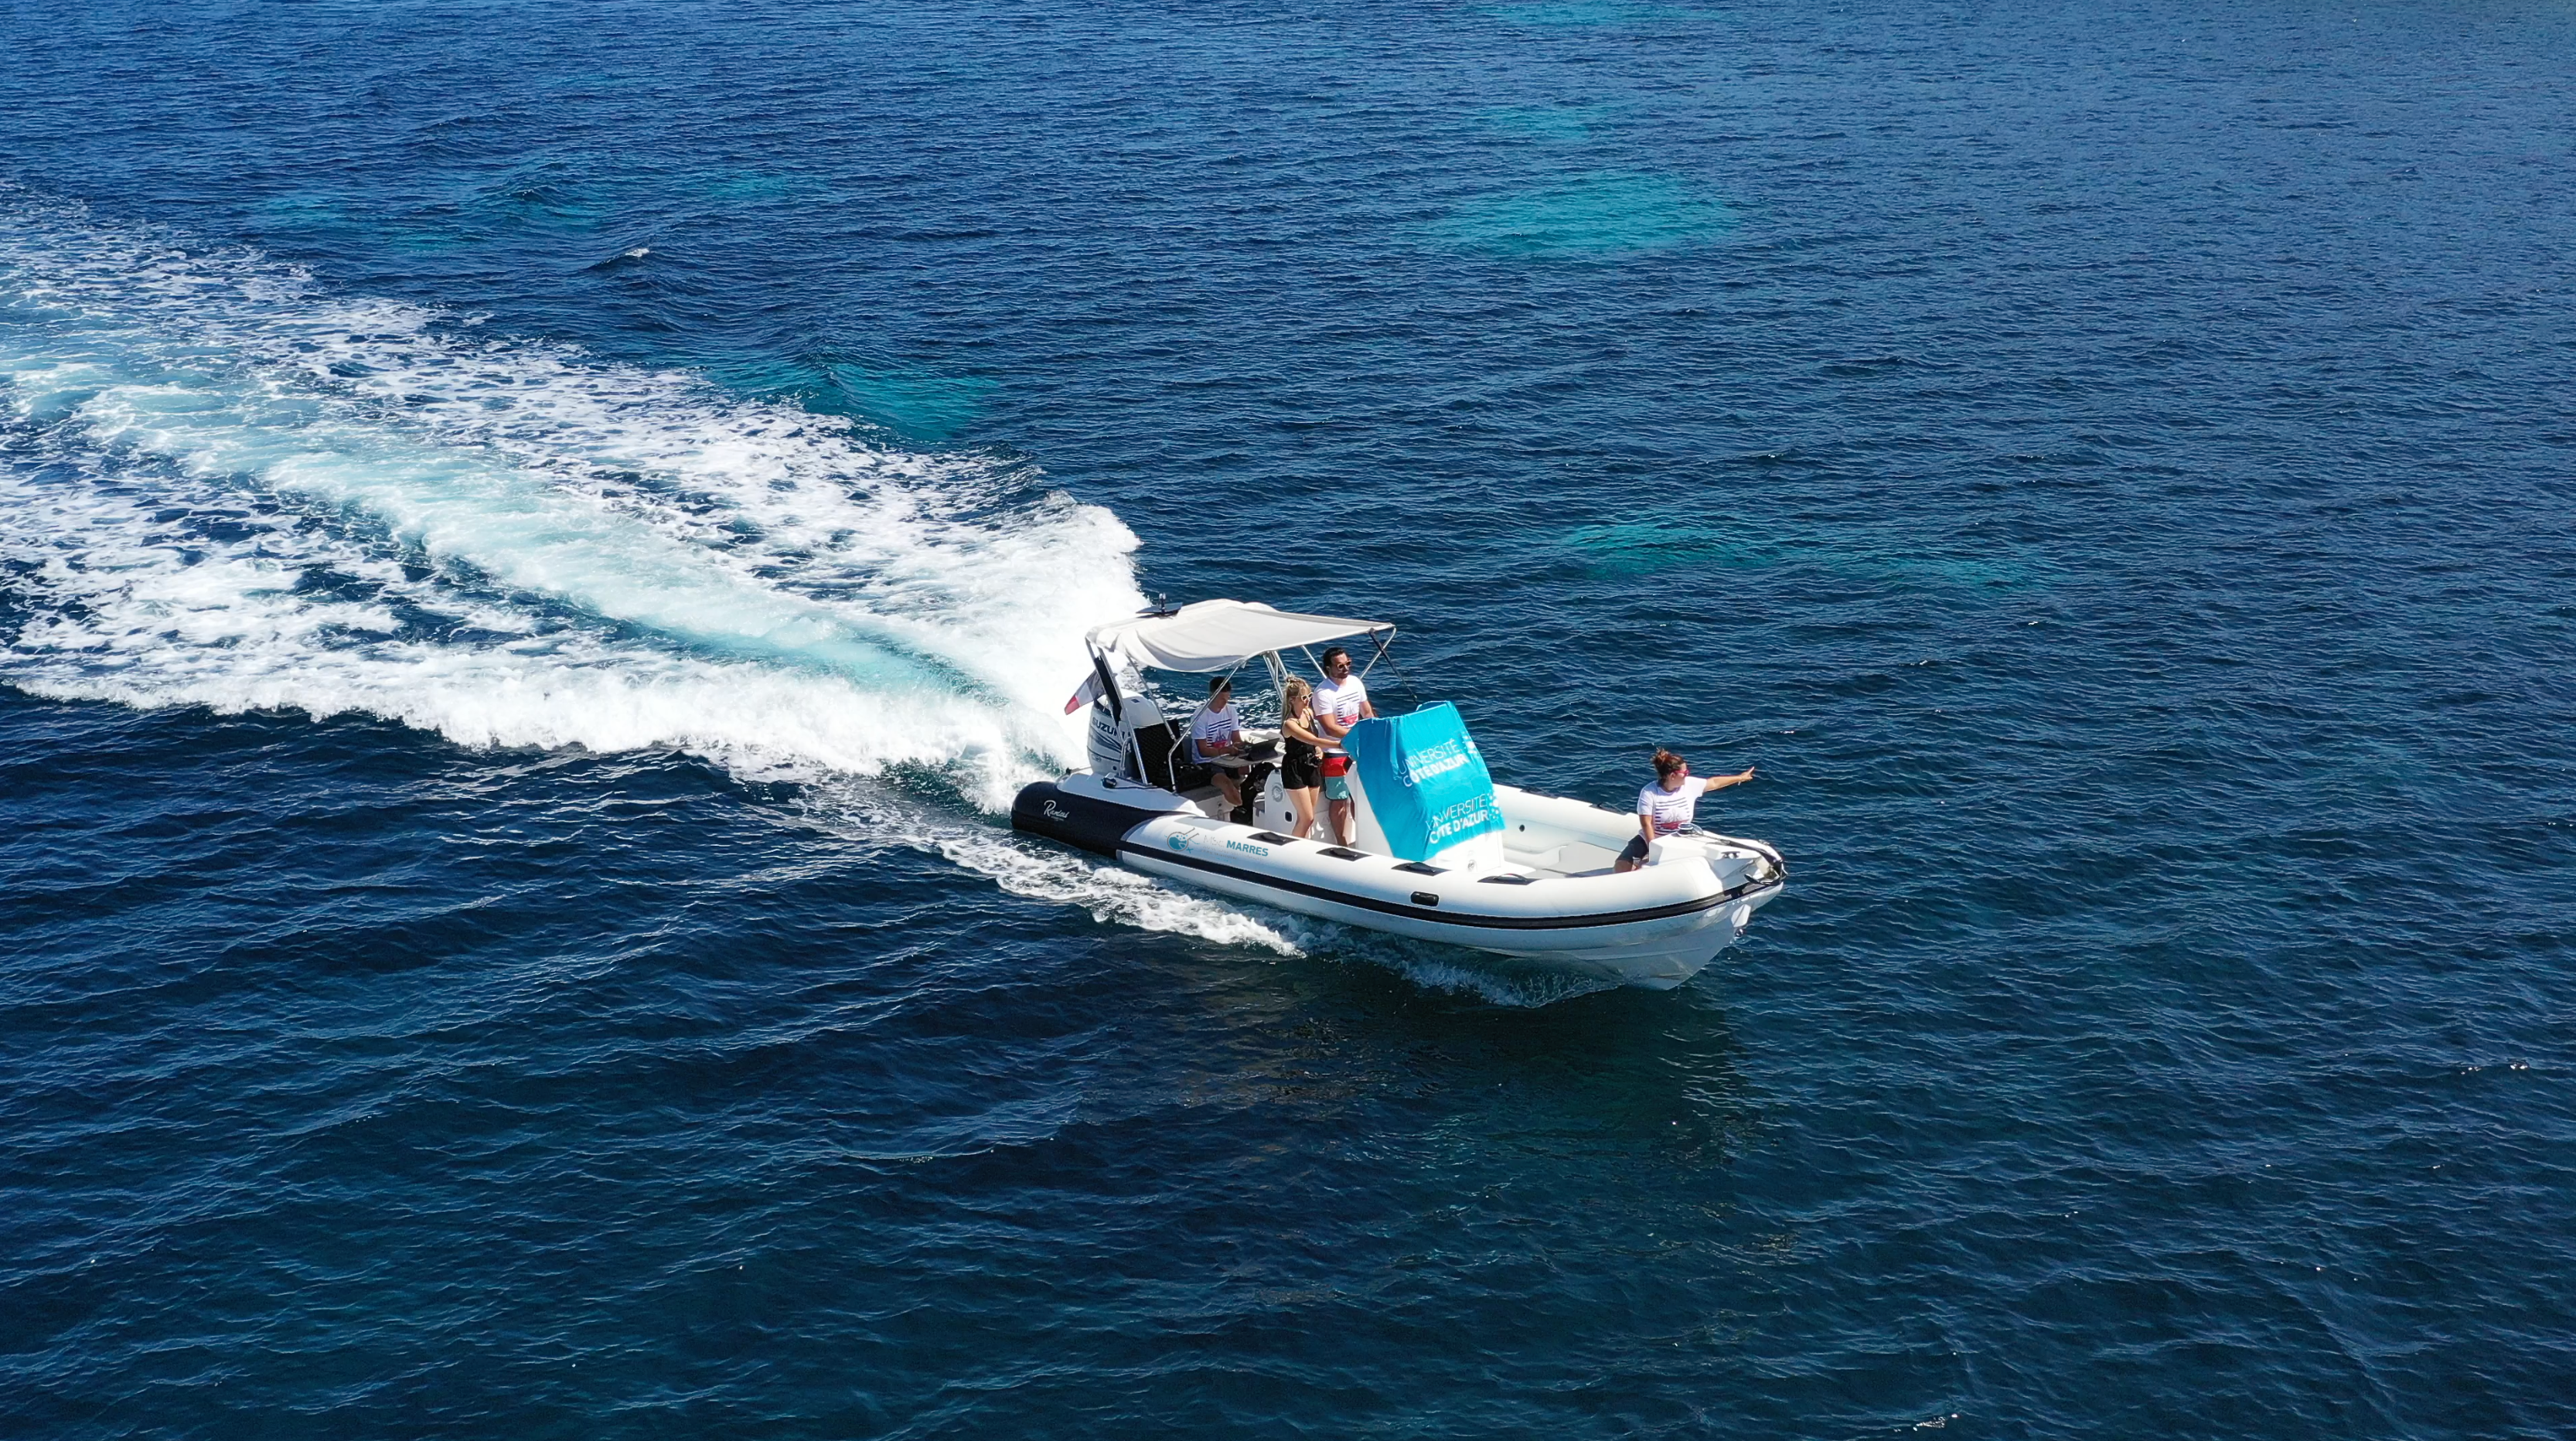
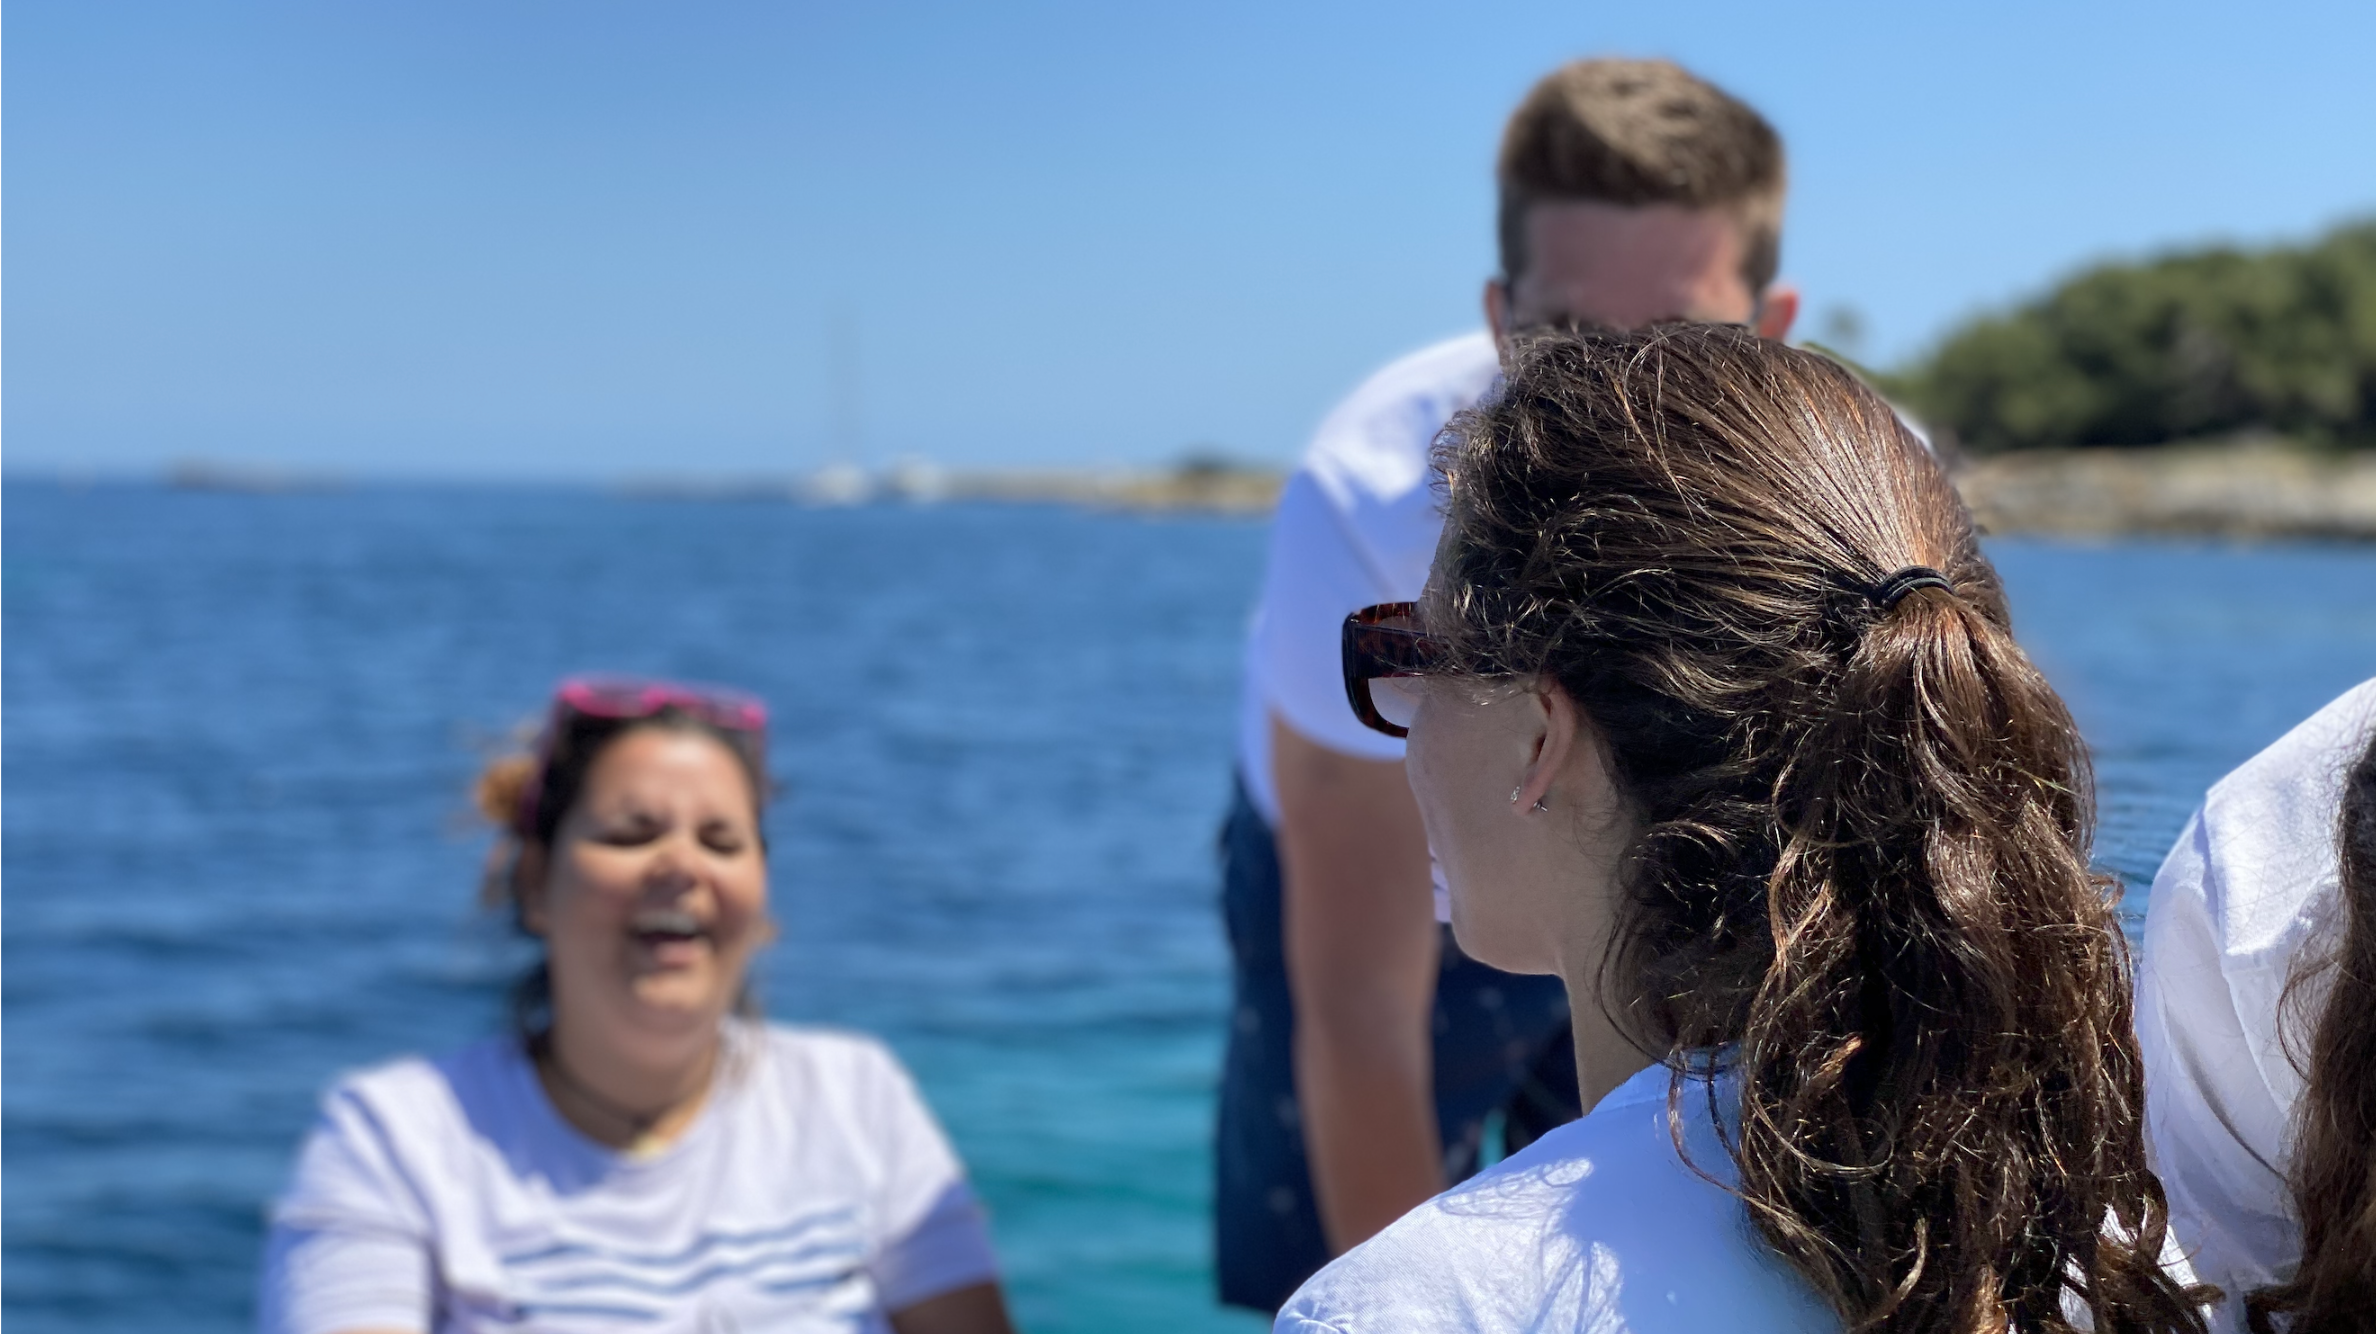
Happy staff supervising the students
The leg 2 (new missions)
In parallel with Leg 1, which has been running since 2012, students also test new research hypotheses during Leg 2.
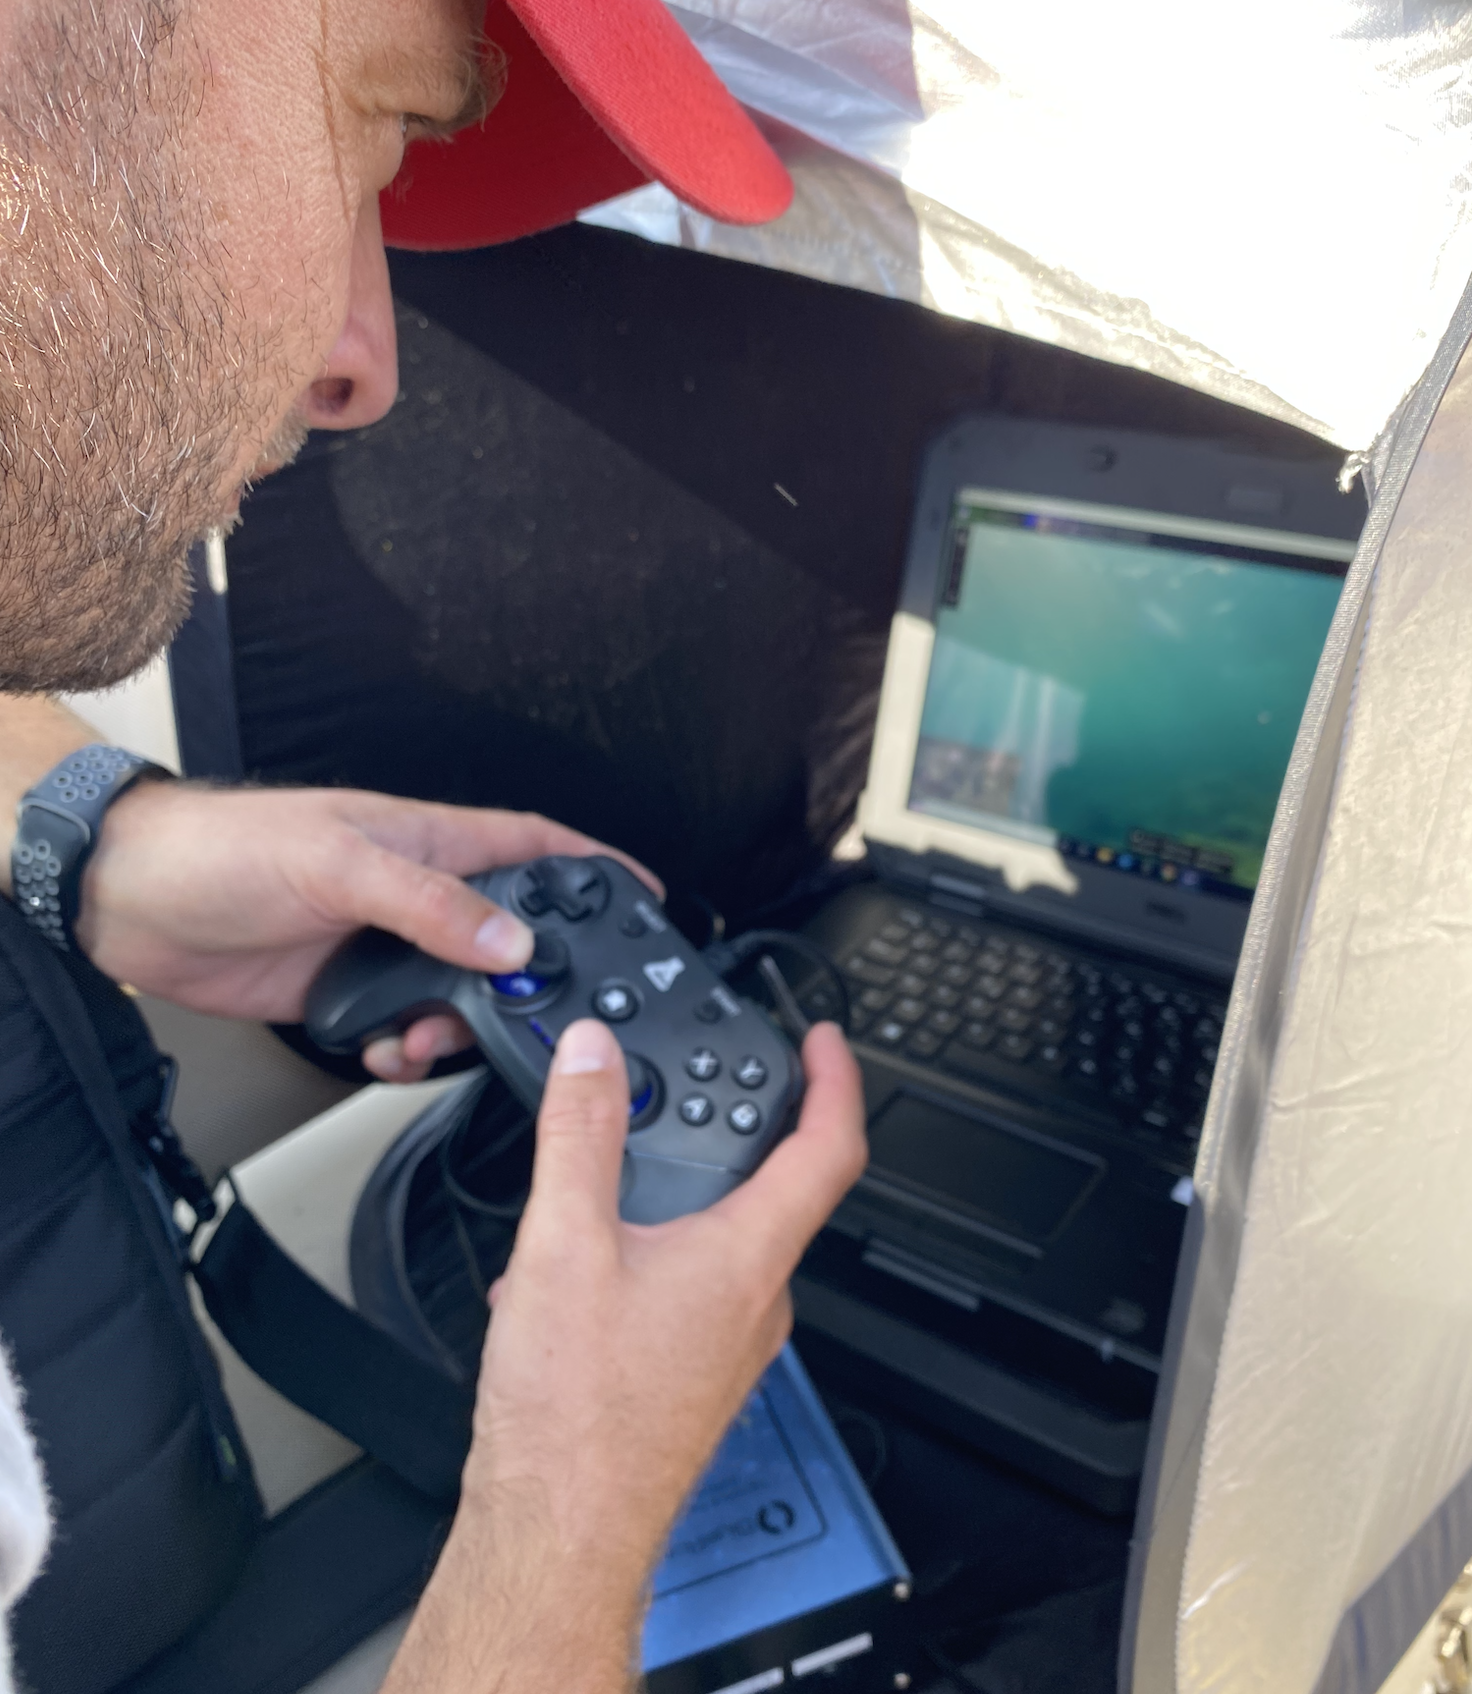
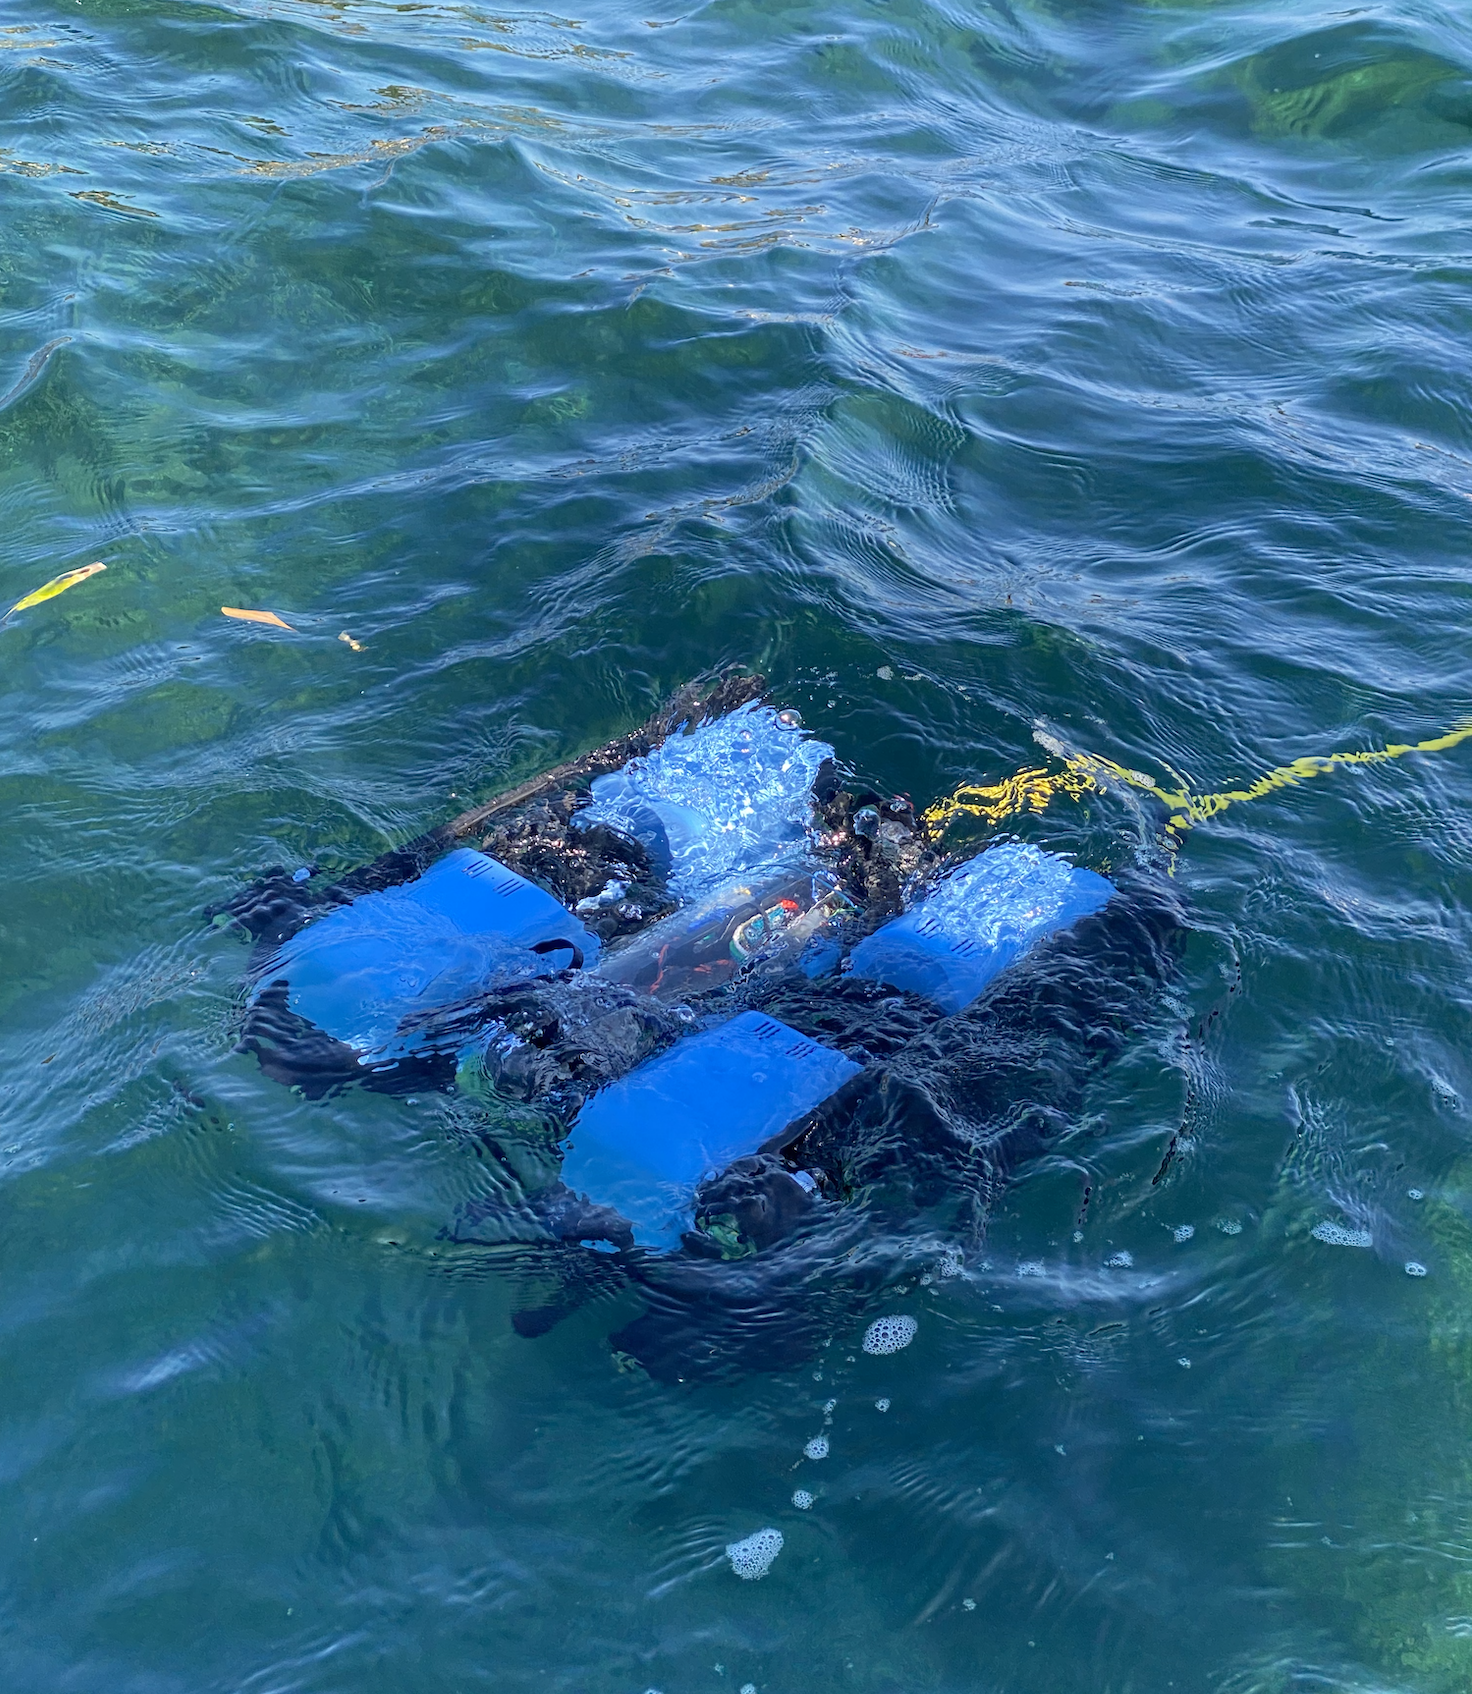
These missions are designed by the “veteran” Year 2 students for their Year 1 peers. They explore new methods and scientific questions, such as adapting the monitoring protocol for citizen science, using drones and ROVs, or assessing human impacts linked to boating, beach activities, fish farming, restaurants and shipyards.
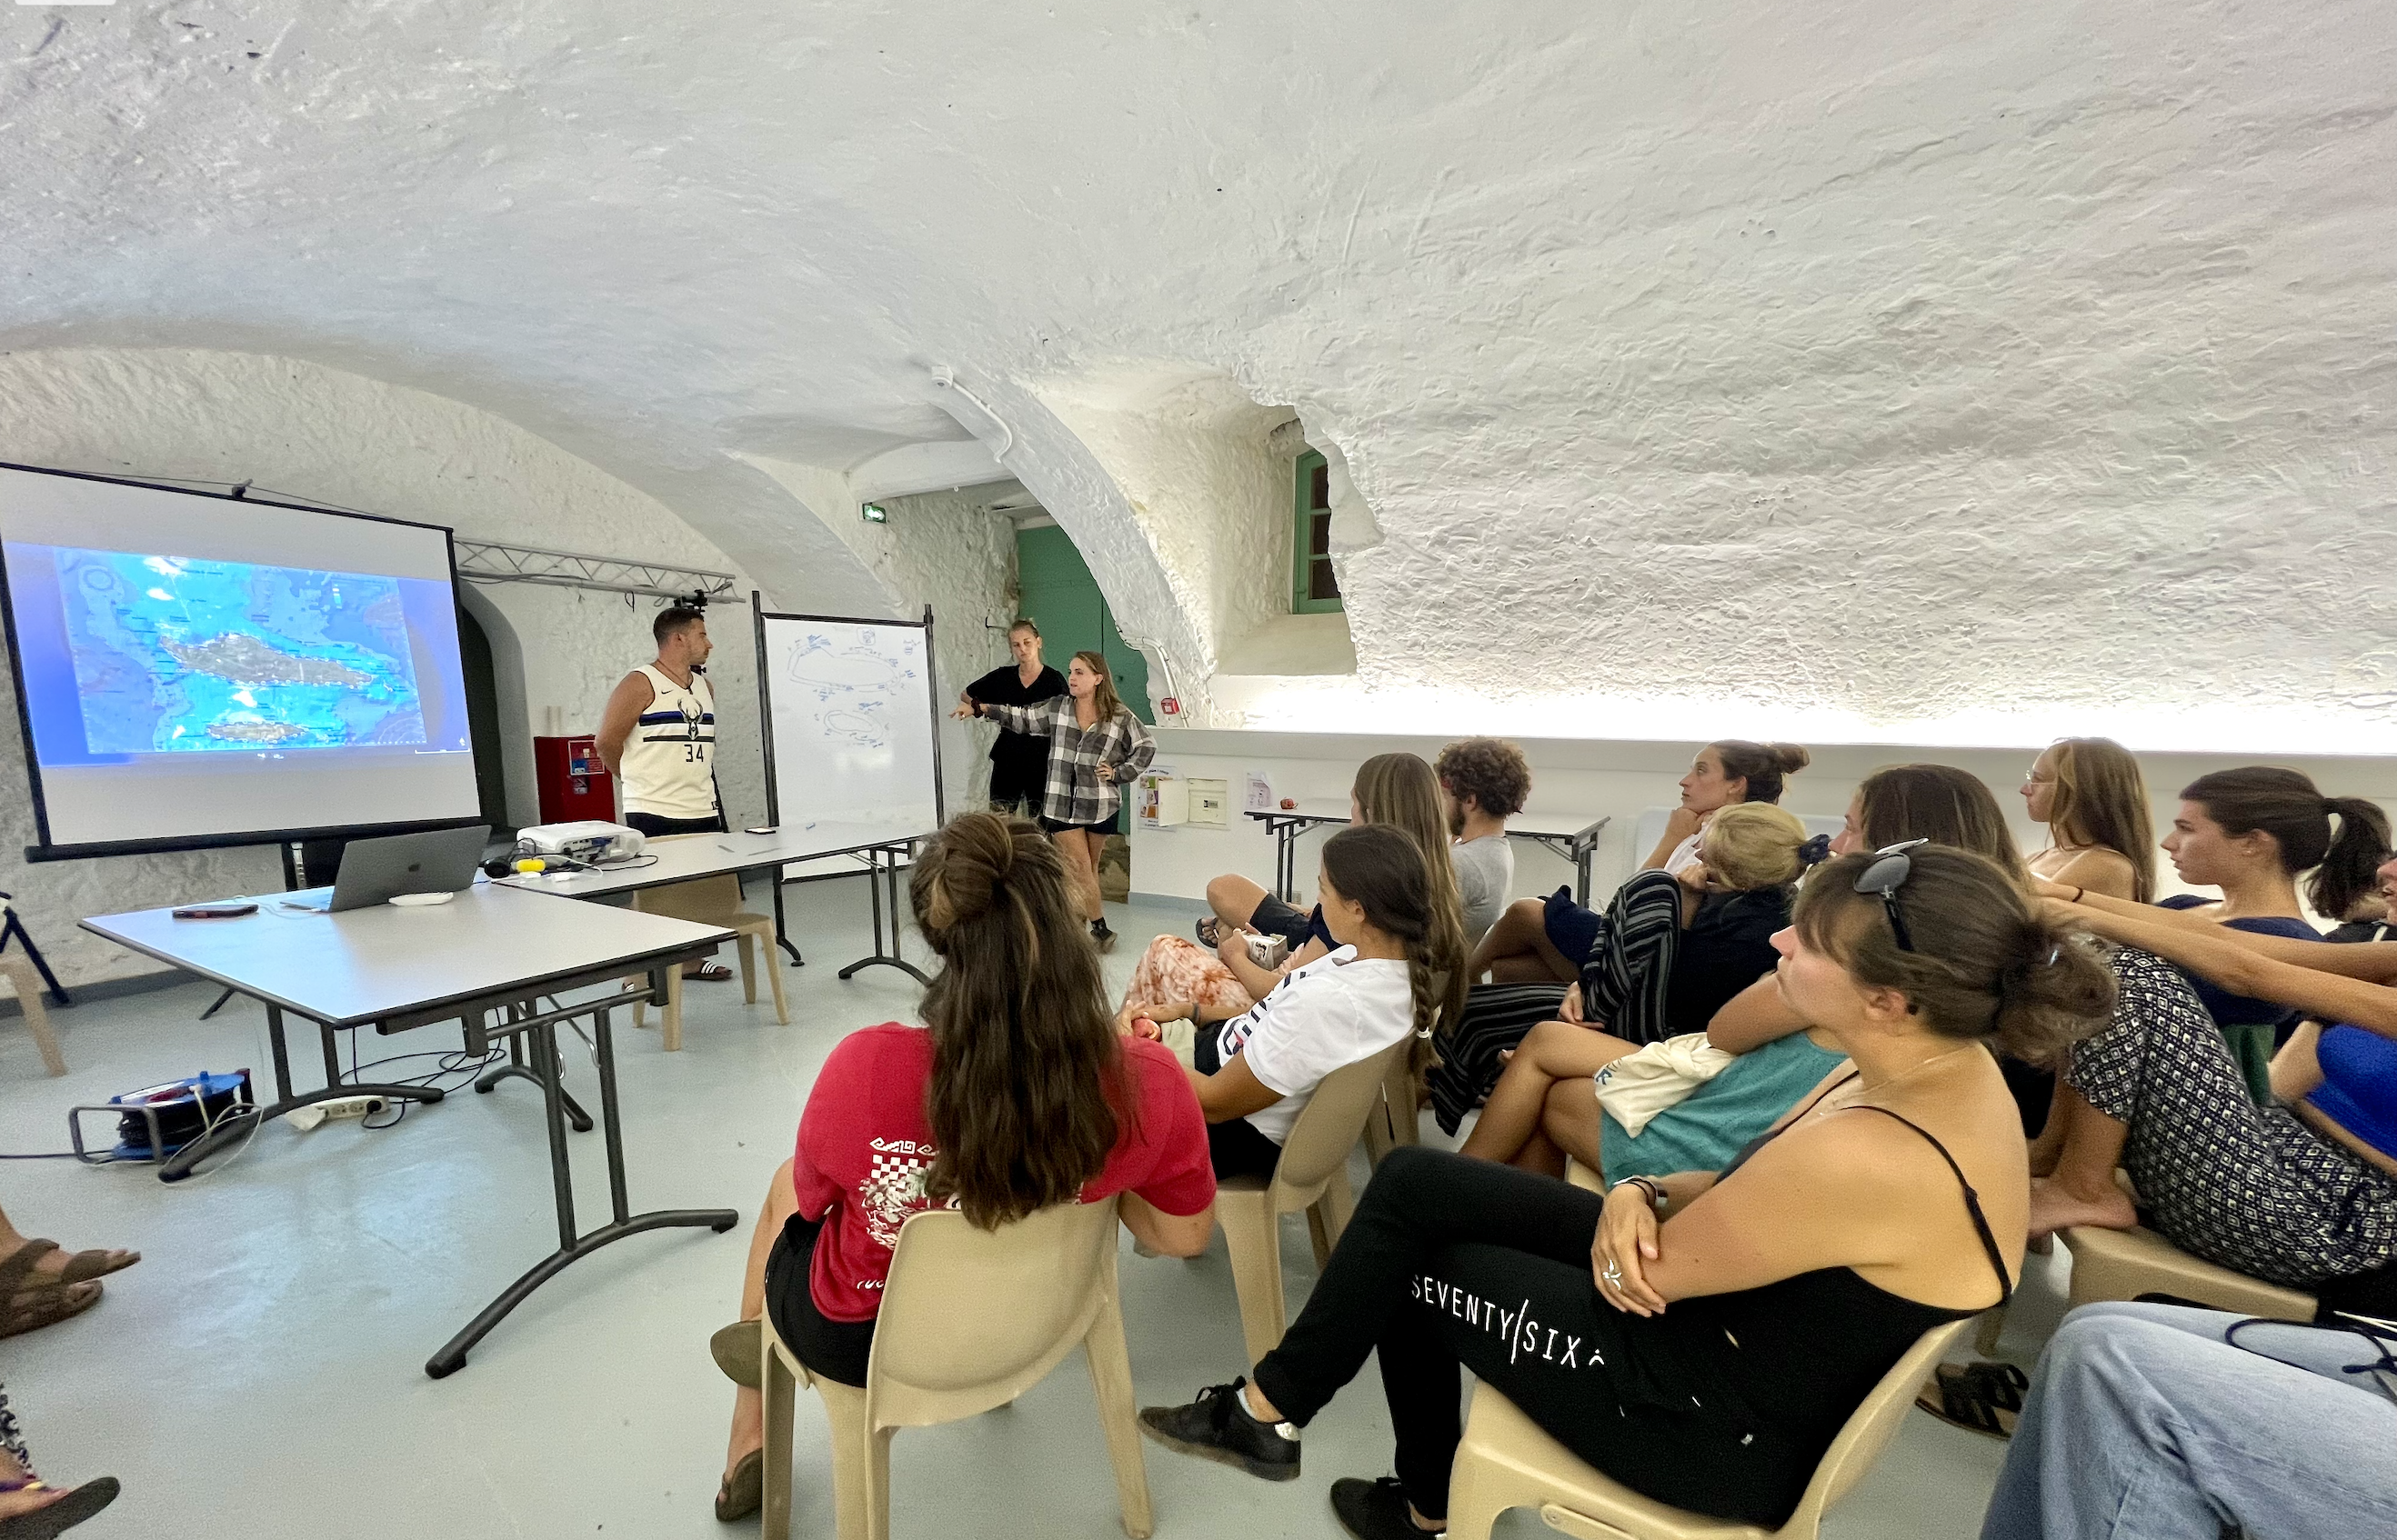
Briefing meeting when Y2 students explain the missions to their fellow Y1s
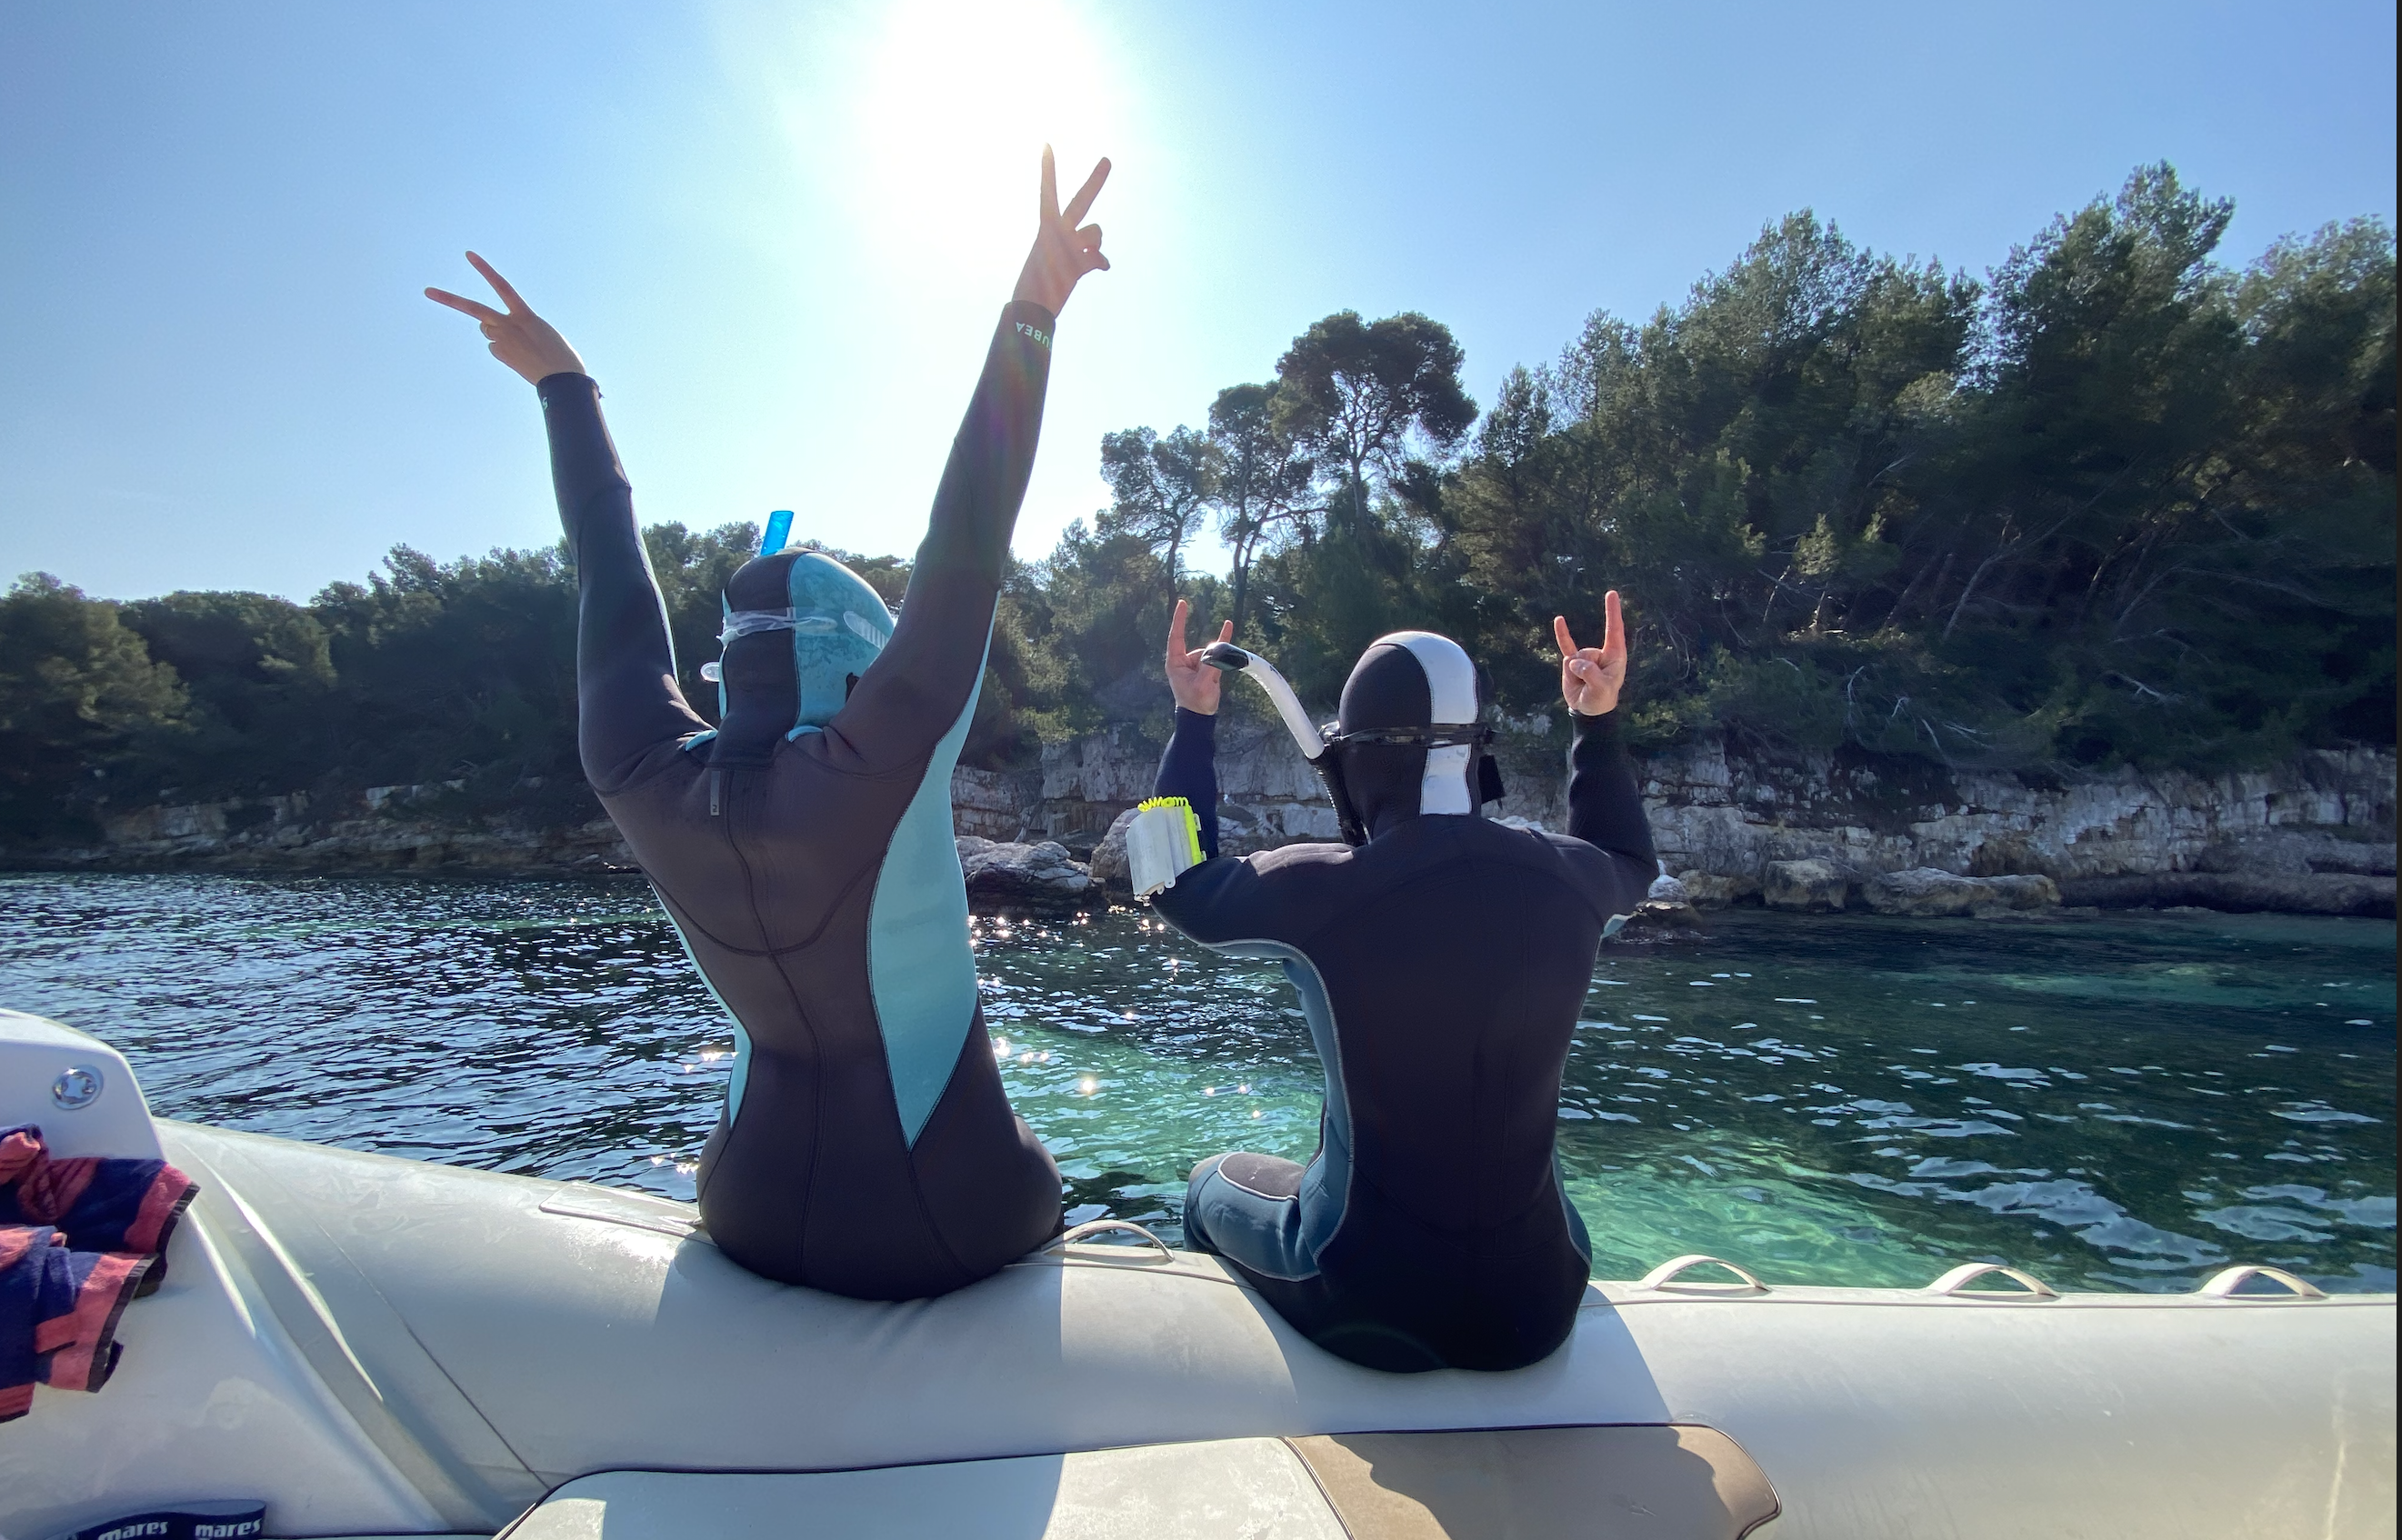
A new method is being tested to empower people through citizen science
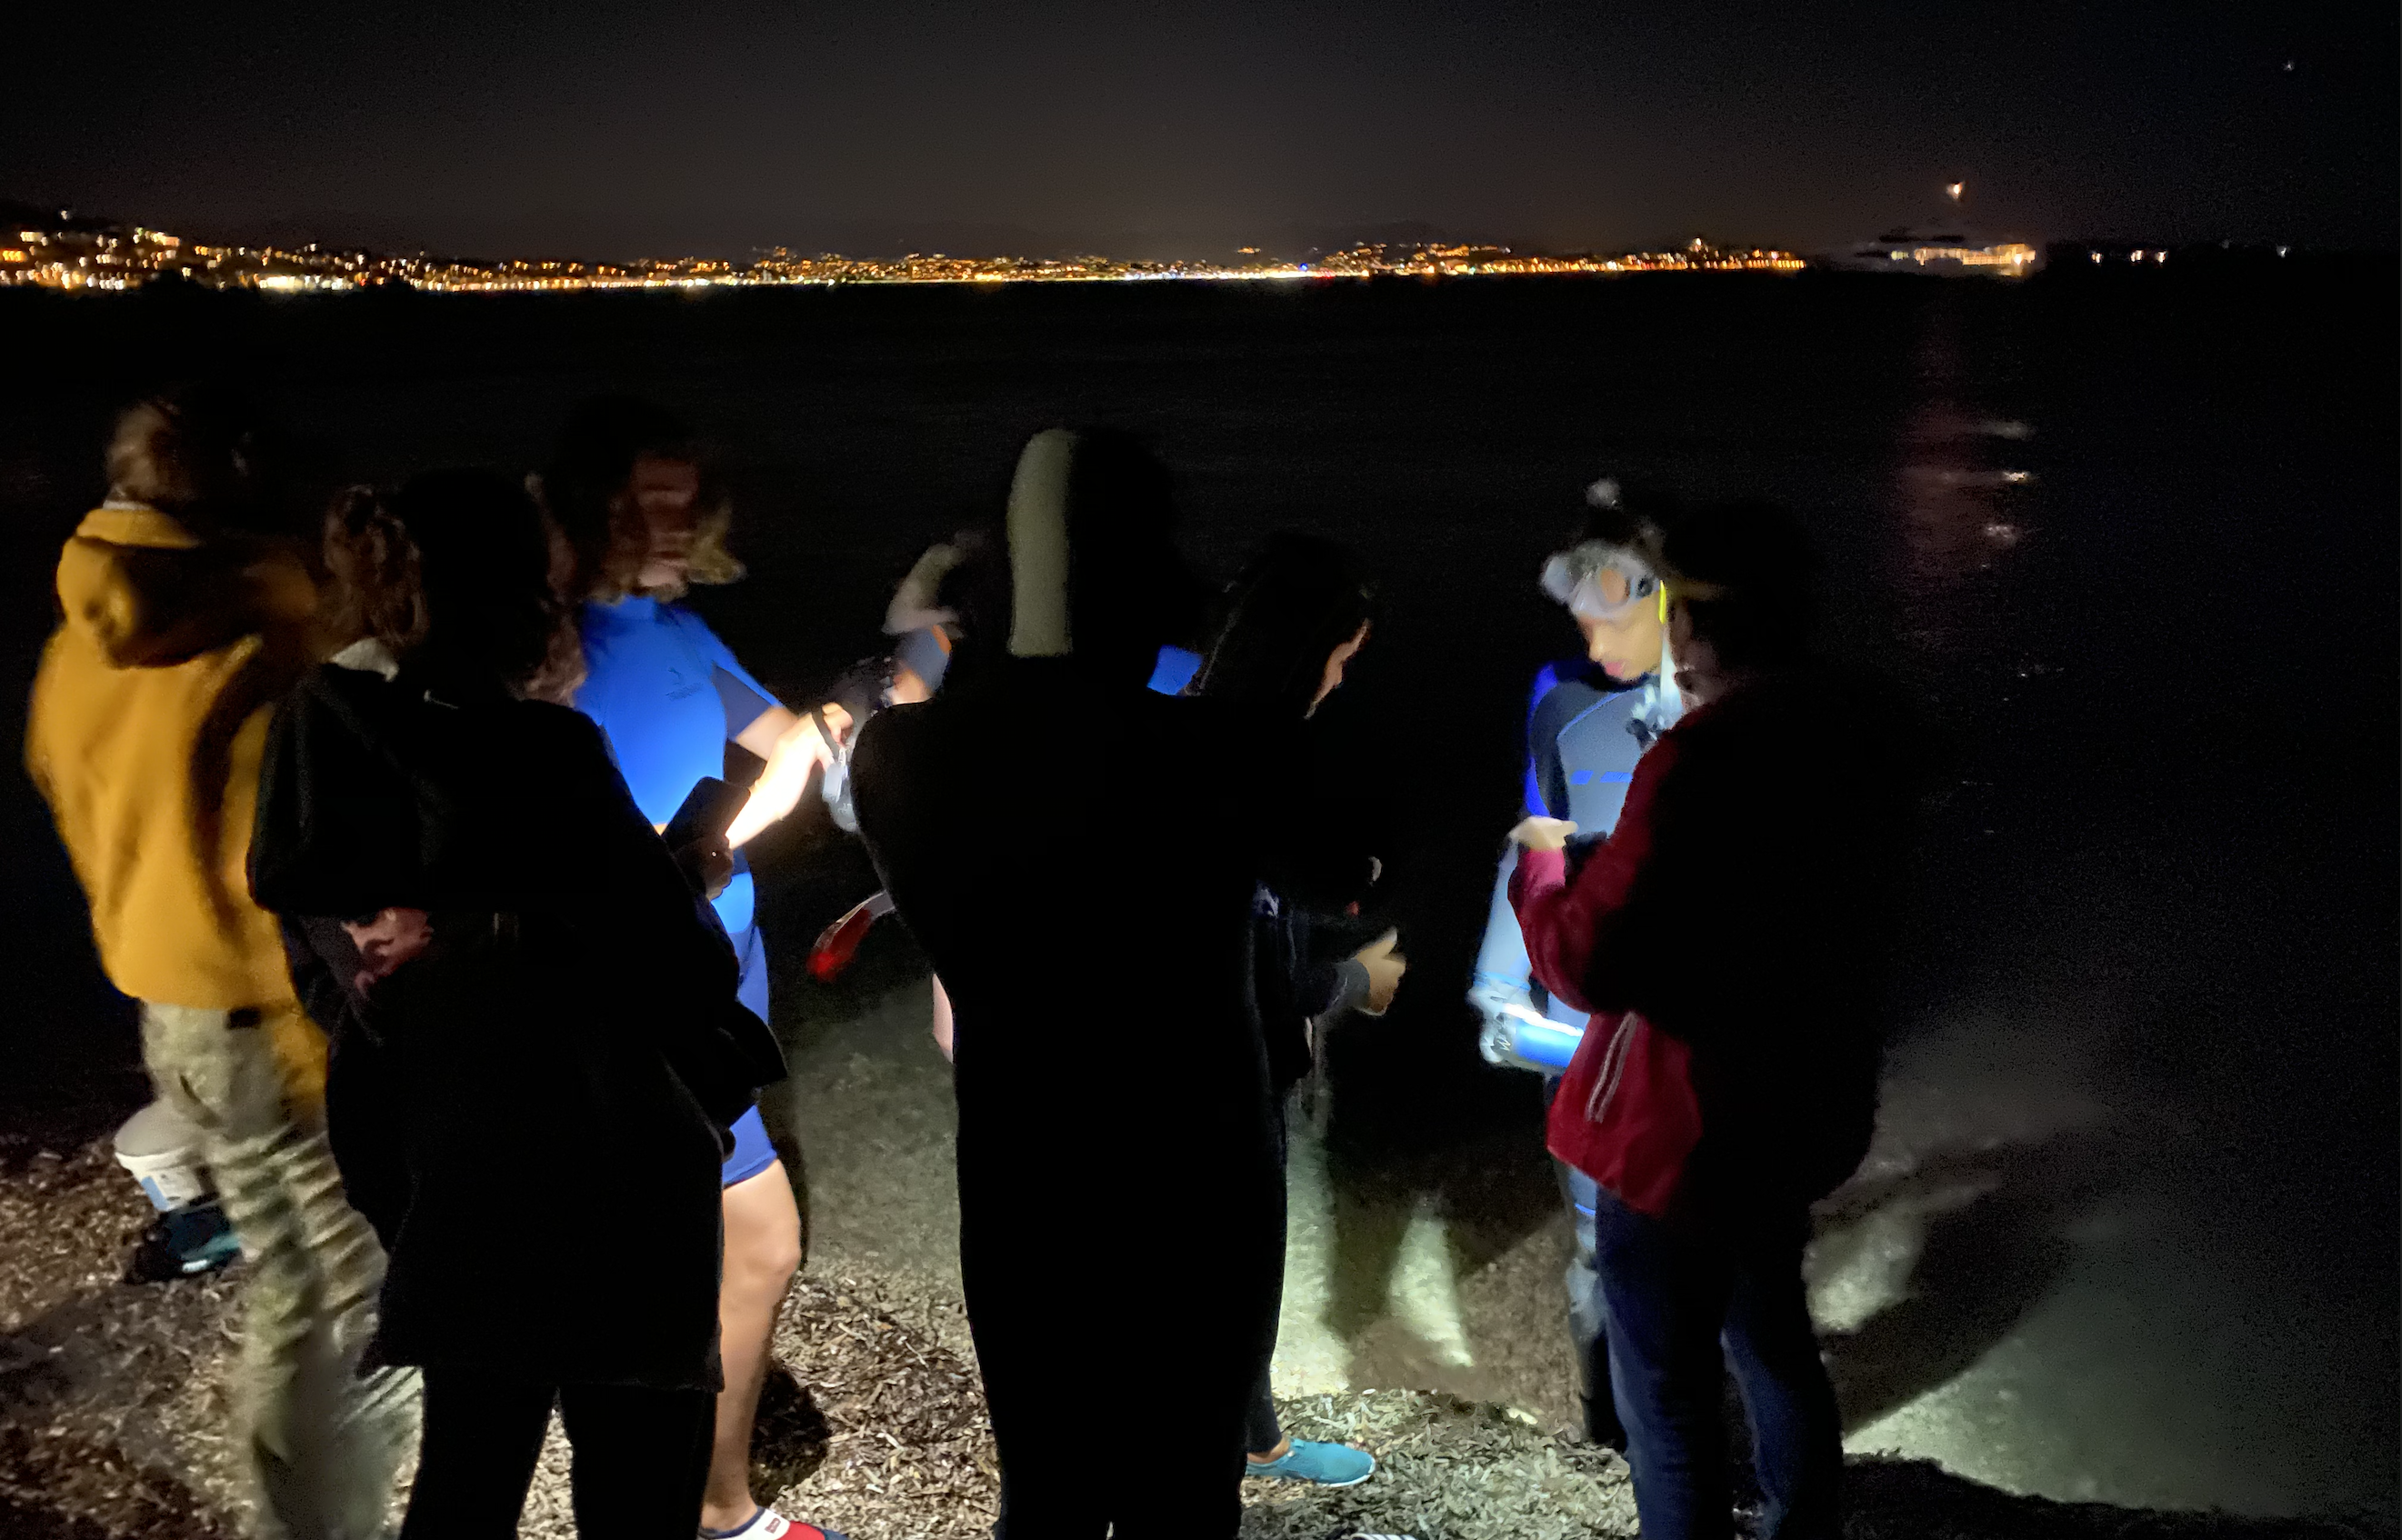
Sampling at night to compare day/night fish assemblage and behavior
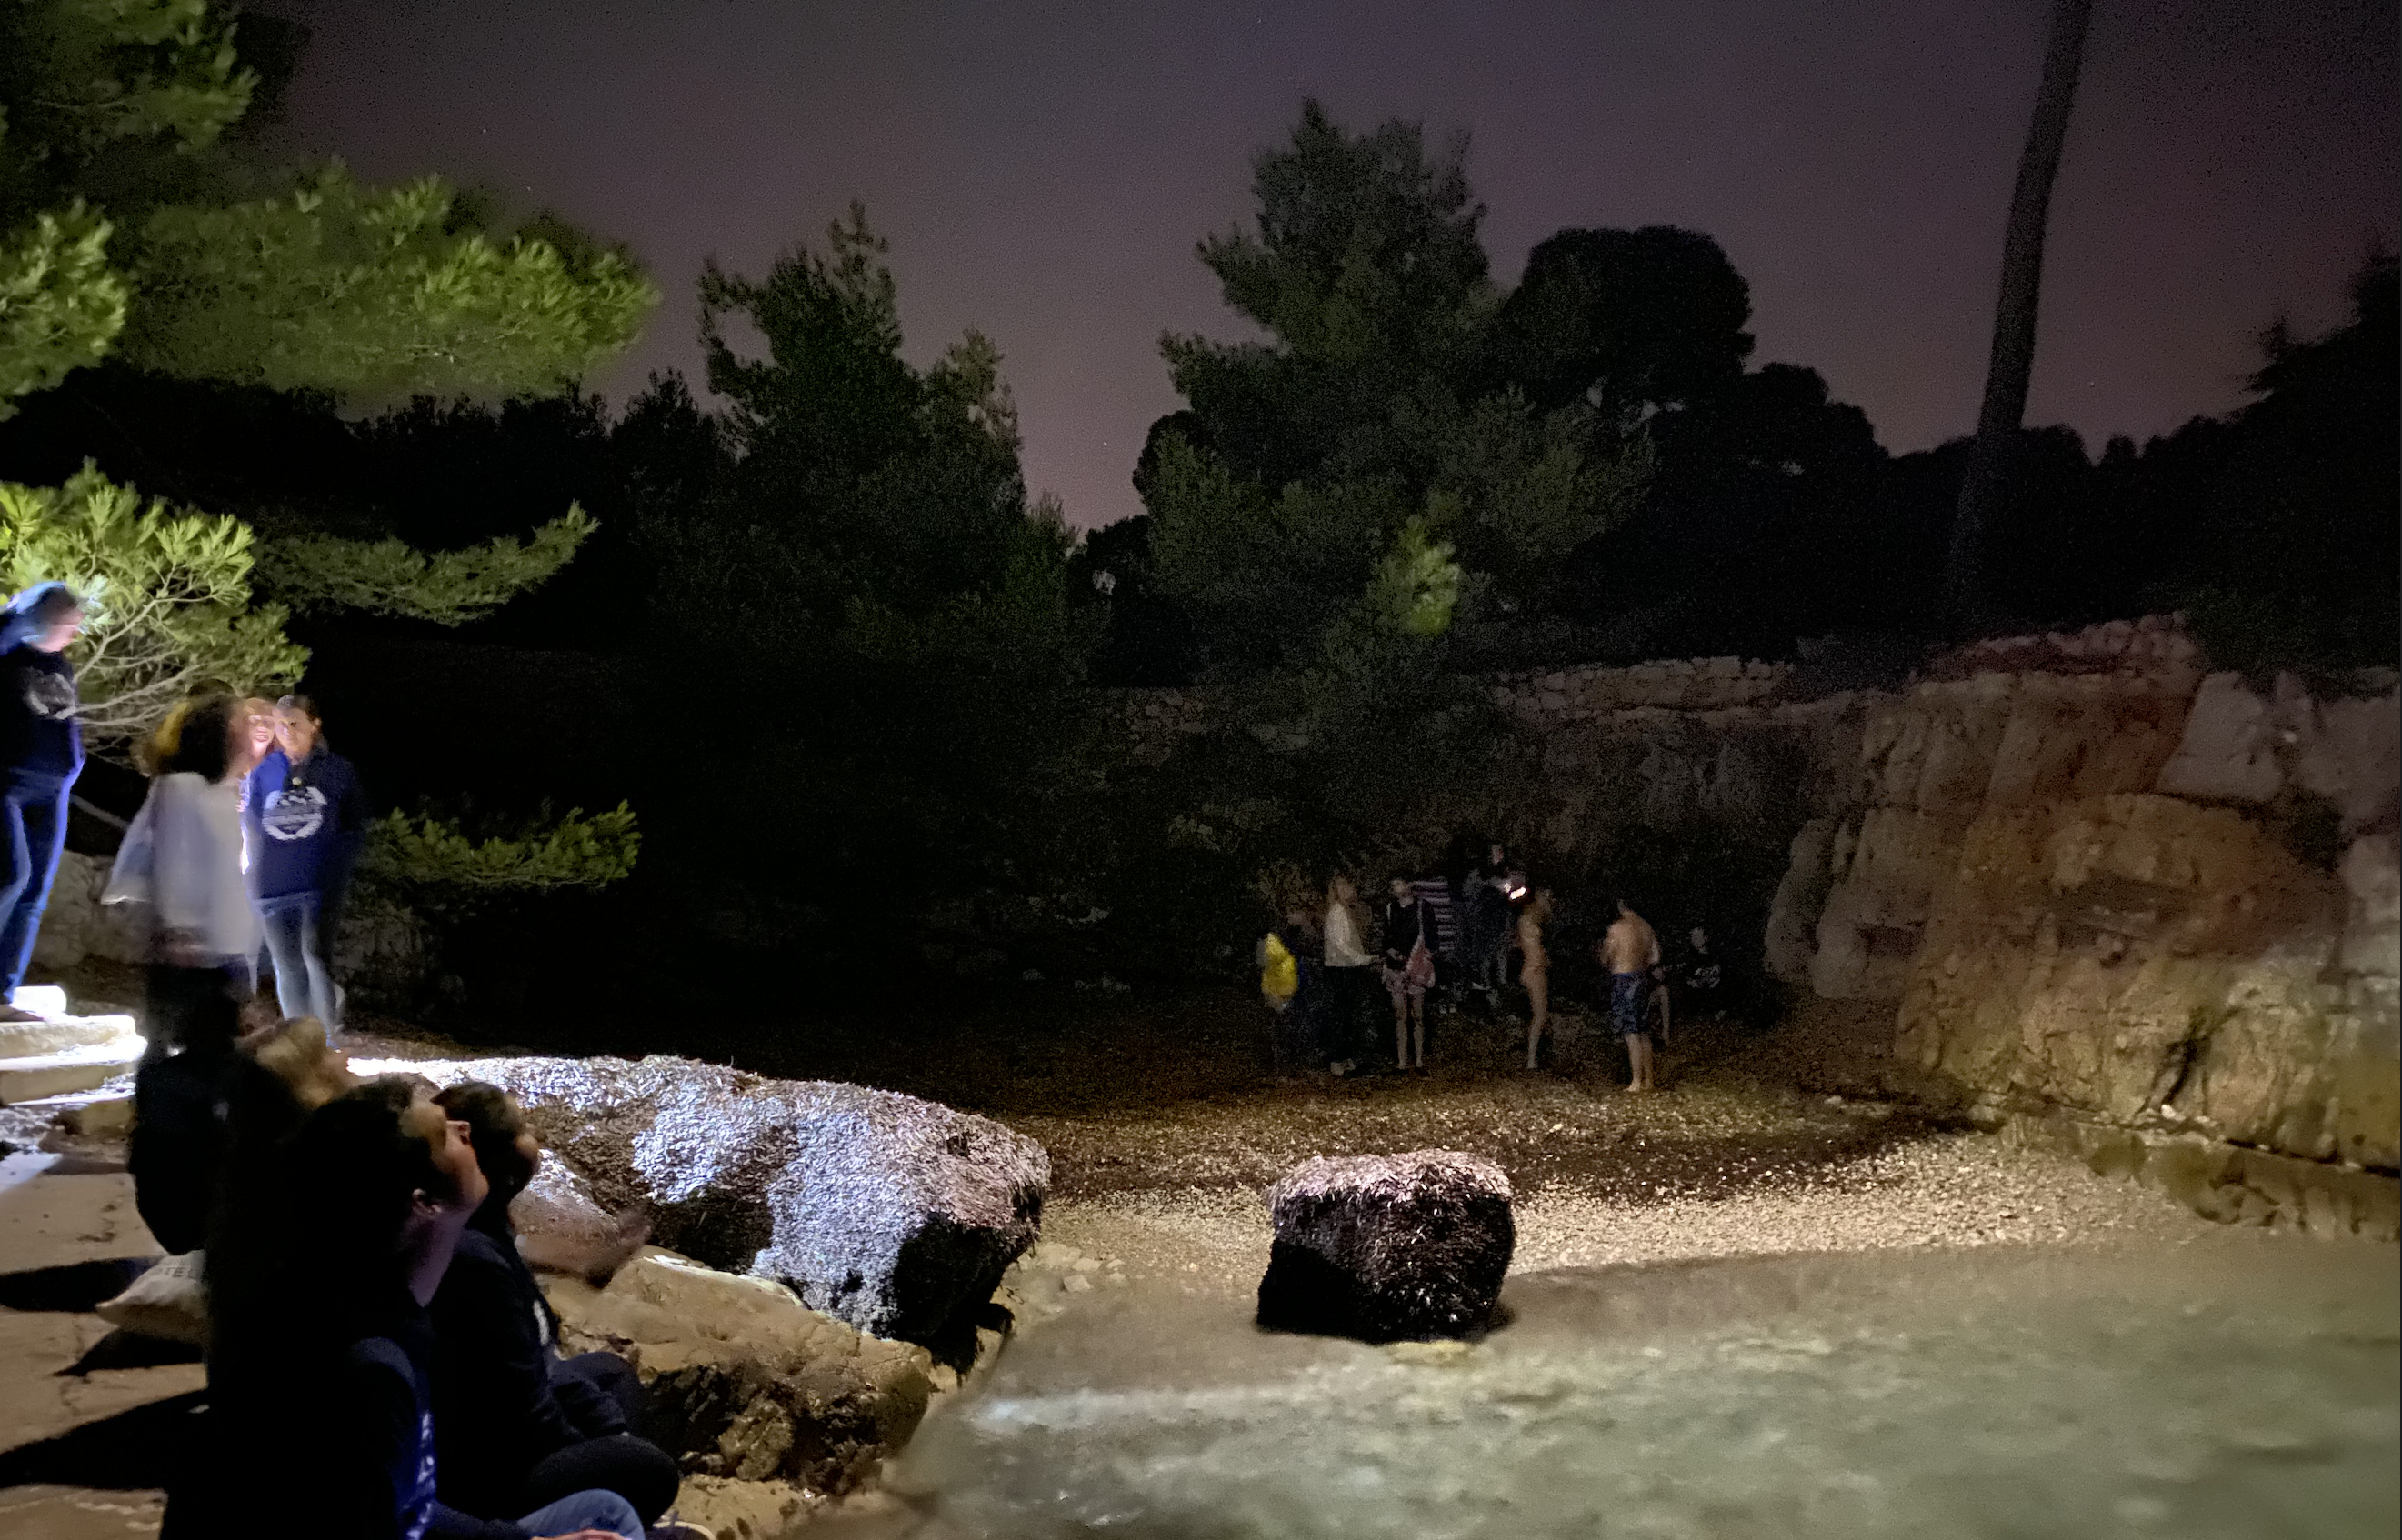
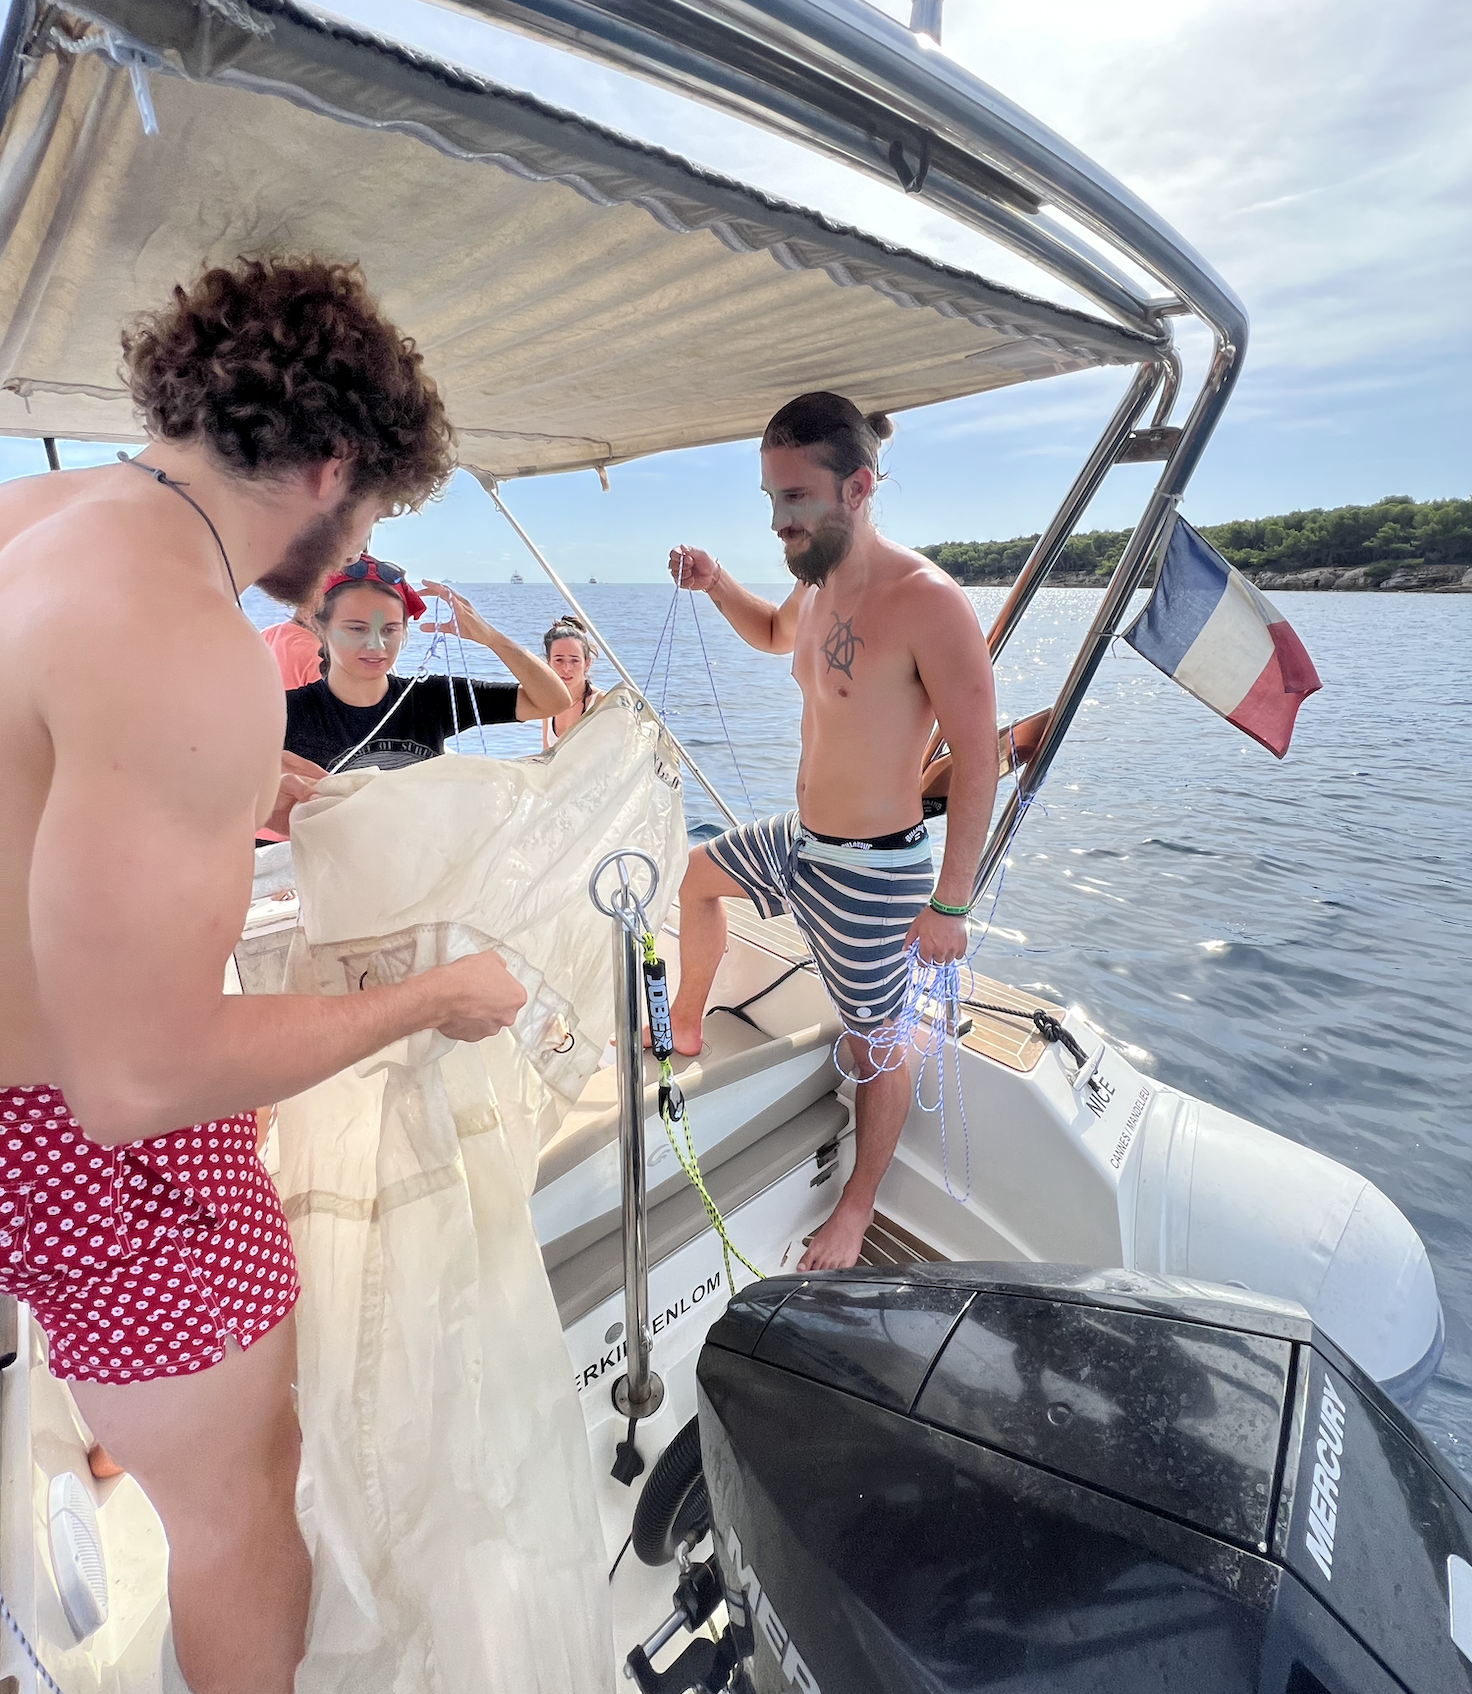
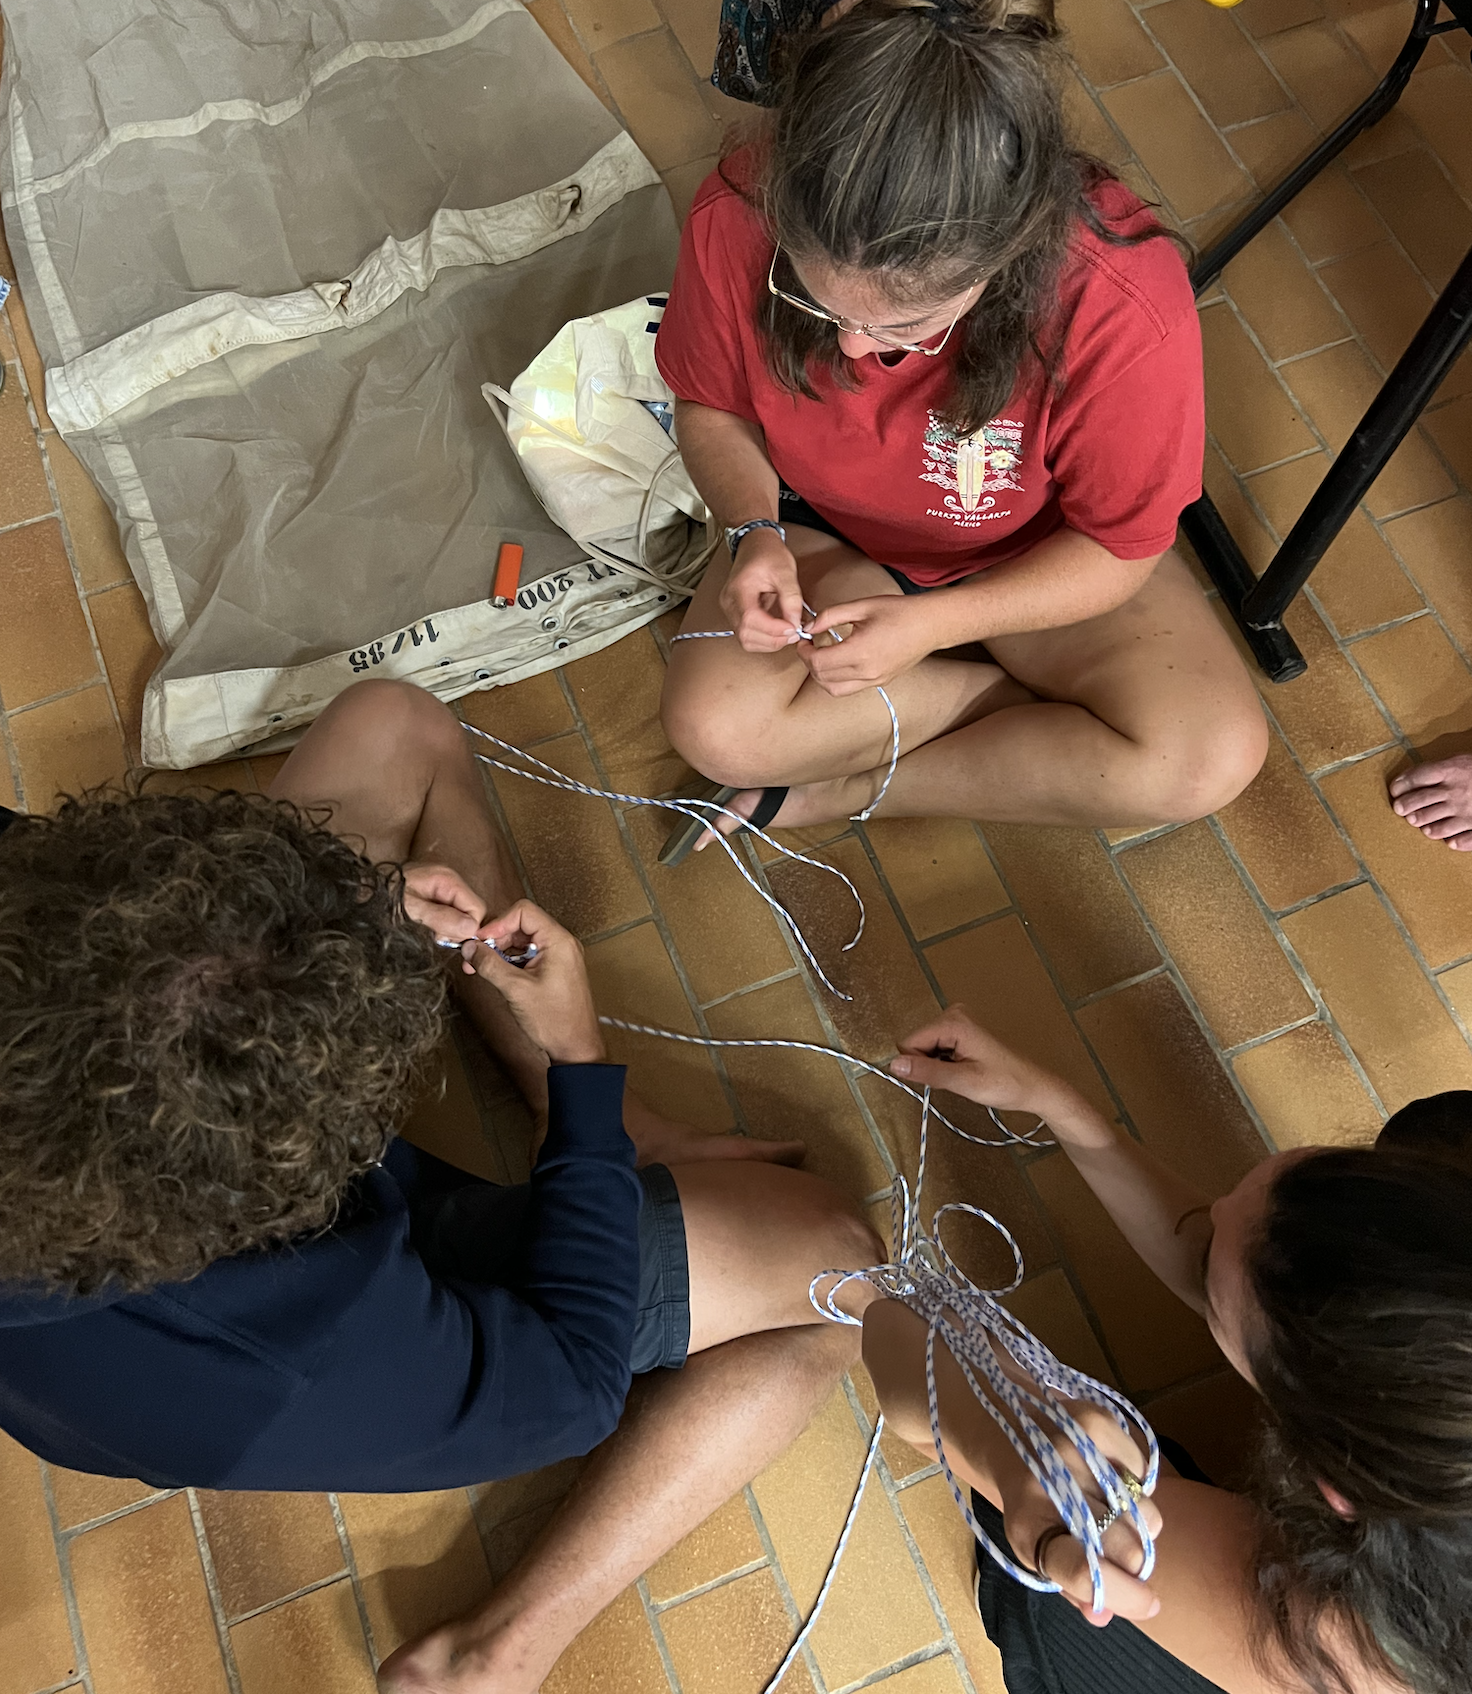
Adaptation of the plankton net for an ecotoxicology assay
An integral part of the MARRES learning strategy
The Scientific Adventure (SCAN) module is at the heart of this field project. Before the mission, Science & Society Year 2 students design the Leg 2 sampling strategies for the Year 1 students. After the field trip, Year 1 students use the data they collected to apply the concepts introduced in class.
They choose a research topic and work on it in groups for at least one semester. Quantitative and computational tools are then taught using data generated directly by the students at sea, including statistics, multivariate analysis, R and GIS.
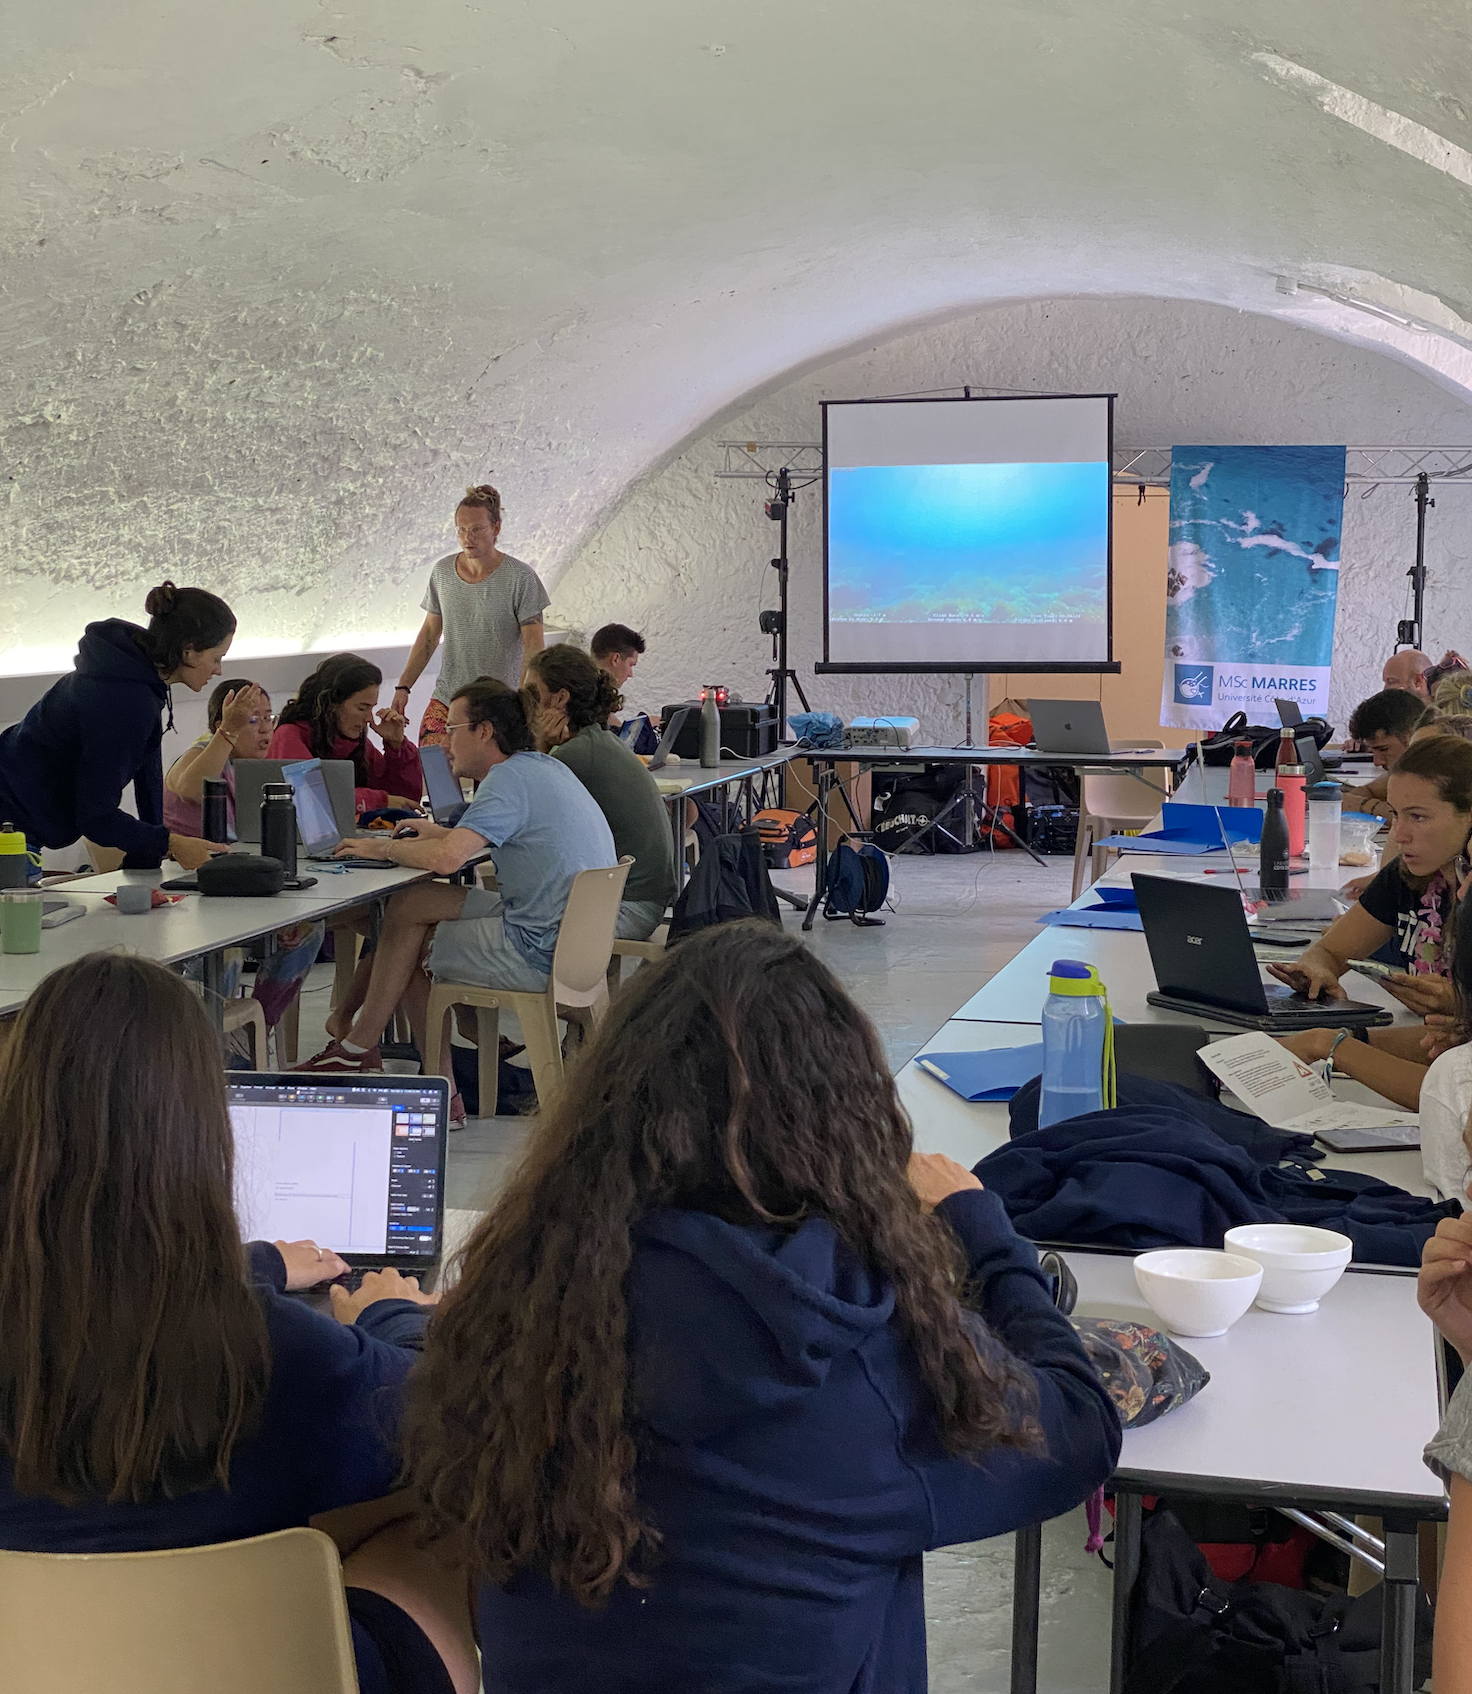
Last day at Lerins, securing data on database and first look at the results
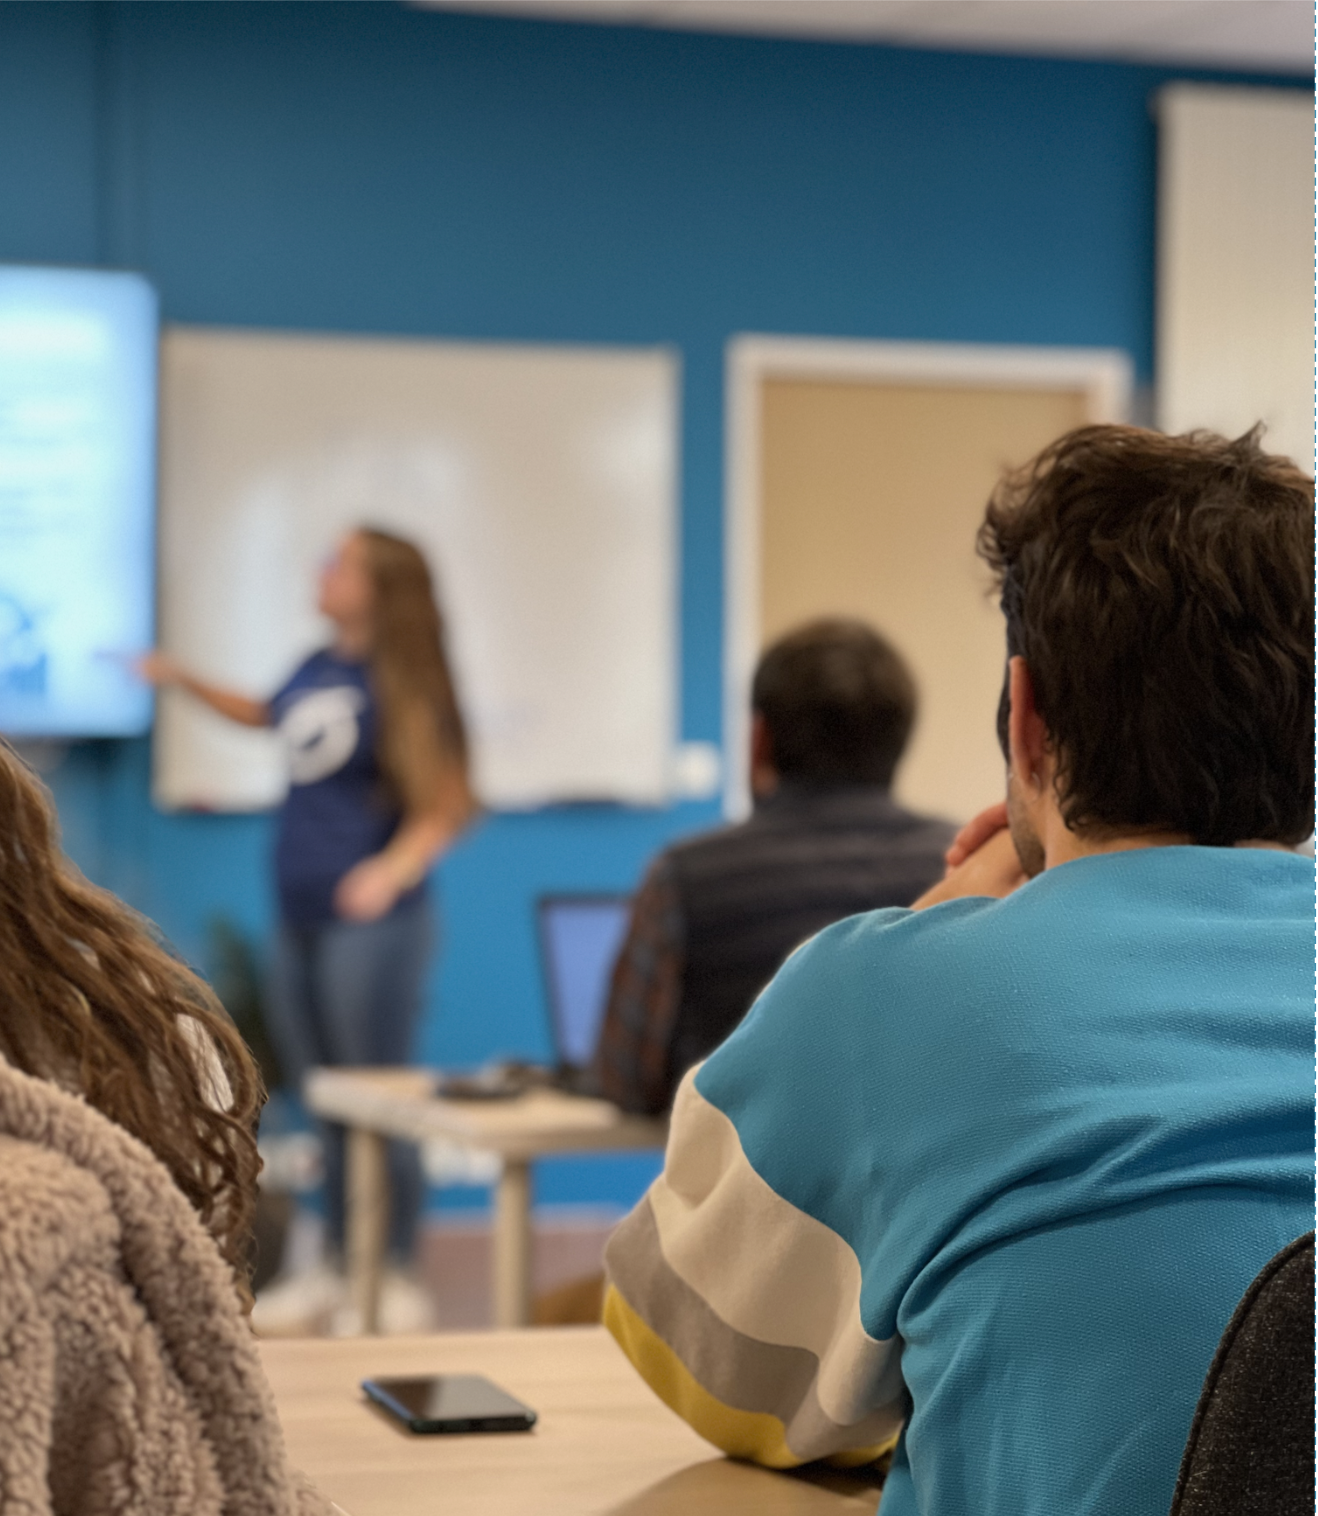
Last day of the semester, presentations of the student projects as part of the module on the "Scientific Adventure" (SCAN)
video from R. Weston
Dive in the Lérins Biodiversité project